Modern applications typically weave together an impressive underlying architecture of microservices with serverless and container technologies to make sure your service works seamlessly for customers. Unfortunately, when problems arise with your application when you’re on call at 3AM, this microservice tapestry looks less like a beautiful picture created by teams working in harmony and more like a confusing, tangled knot.
To get to the root of application performance problems quickly (and ensure you get the most rest at night), you’ll need to rely on observability practices to direct your attention to where problems originate. In the context of microservices, you’ll need to consider whether log monitoring is enough to provide you with enough insight on your applications. Should you add other types of monitoring for a more complete picture? Setting up tools could require your time and resources that could otherwise be spent doing other work.
When should you use log monitoring?
Log monitoring, or logging, is a method of tracking and storing data to ensure application availability, and to assess the impact of transformations on performance. This sounds great, and logging is widely used. More than 73% of DevOps teams use log management and analysis to monitor their systems. However, there are some serious drawbacks to using only logging as a solution.
When log monitoring isn't enough
Manual logging can be time-consuming and imbalanced
Sorting through logs is a tedious process that can be error-prone. You might spend hours setting up the right levels of granularity on your logs, only to find that this is less than helpful in production when you need exact information to find out what has gone wrong in your application.
Adding new information about debugging processes into log files takes up precious time and you have to identify every potential piece of data that may be needed beforehand. (Hopefully, you have a crystal ball available in advance of any conceivable problem!)
You need to create the perfect balance of logs when debugging code, adding only enough to debug any problems within a program quickly. If you don’t provide enough information in your logs, you won’t have enough information to debug. But if you add too much, your approach can become resource-intensive because you'll need to analyze so many logs. (Again, better get good at gazing into that crystal ball.)
Logging can be difficult to track across multiple services
If your application is like most out there, it's using countless services, containers, and processes. So, solving problems with application performance might require you to understand all the relationships between different logs. If you’ve woven the entirety of the app yourself, maybe you can connect all the threads. Yet even in this case, you’ll still have to read through the raw text of the logs to remember how everything connects.
If you need to explain these connections to someone else, the fastest way might be visually, showing the depth of a problem within the nest of microservices. But because logs only report text, you’ll have to spend more time either making a chart or talking it through with your colleagues.
If you have a complex or hybrid environment, getting the full picture of your system and its overall performance might take too much time and effort to provide sufficient insight in the event of a problem.
What is instrumentation?
Instrumentation is the process of adding code to your application so you can understand its inner state. Instrumented applications measure what code is doing when it responds to active requests by collecting data such as metrics, events, logs, and traces (MELT). So when you fully instrument, you set up how you want to monitor logs and also define how you'll look at other data that can give you more information about your system.
In contrast to an application that isn’t instrumented and only uses point-in-time logs, an instrumented application tracks as much information as possible about the service’s operations and behavior. It provides more detail about what is happening, so you can see relationships between requests.
Pros of fully instrumenting your application
Instrumentation beyond log monitoring provides broader information
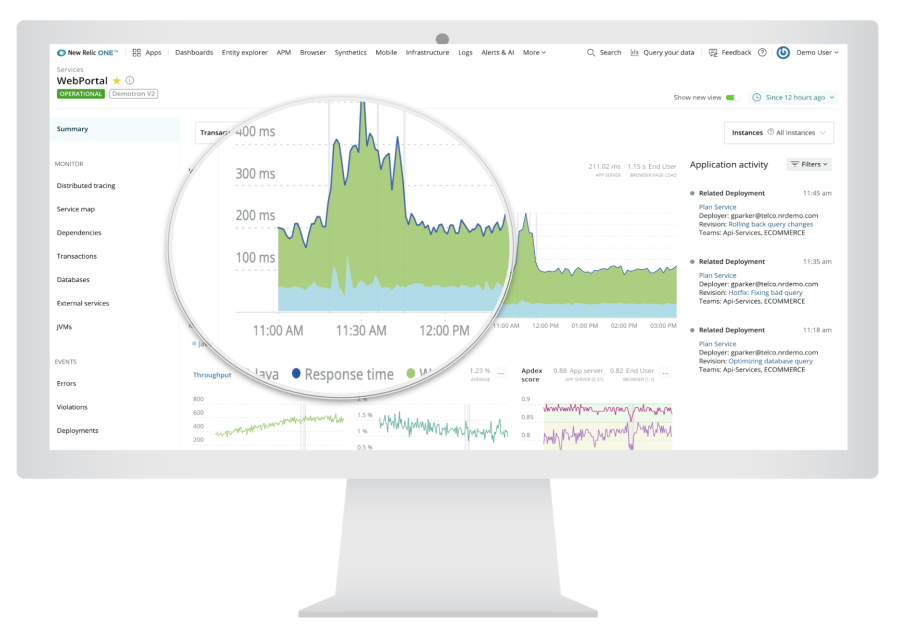
Despite being incredibly useful, instrumentation is an often-overlooked aspect of software development. Many people have the perception that it can be hard to get started and might not provide the same return on investment as simply relying on logs. But instrumentation is key to ensuring your application is performing up to its best. It provides immediate visibility into your application, often using charts and graphs to illustrate what is going on “under the hood.”

With the analyzed data that instrumentation provides, you can solve immediate on-call problems quickly because there is so much data available for debugging.
With proper instrumentation, you can observe complex environments more completely
You can also use instrumentation to see larger patterns over time that you'd miss if you just rely on point-in-time log data. This can help you improve your application as a whole rather than just patching holes. It's important to consider instrumentation as an iterative process that can bring hidden insight to the surface rather than an immediate solution for individual problems.
Instrumenting your application provides quick insights into how each individual component is behaving and performing, and how they're interacting and communicating with each other. This means you can effectively monitor and analyze distributed systems, a major challenge.
Should I rely only on log monitoring?
Log monitoring is just a subset of monitoring that you’ll establish when you instrument your application. Full instrumentation should include monitoring for other signals, so you’ll want to choose a full-platform tool for the best insight into the performance of your application.
You’ll need both the granular information for logs for specific cases and monitoring of events, traces, and other signals for other use cases. With a fully instrumented application, you can keep your finger on the pulse of your system, even in the face of complexity and dynamics. Whether it's distributed systems or multi-layered applications, you’ll have the necessary visibility you need besides just a sea of complicated log data. And when you do look at logs in context of your other telemetry data, it will be simpler to troubleshoot.
次のステップ
Learn more about New Relic open source instrumentation and New Relic Instant Observability integrations.
Sign up for a free account today to take advantage of log monitoring and the 30+ other capabilities of the New Relic platform. Your free account offers 100 GB/month of data ingest, one full-platform user who can use all our tools, and unlimited basic users who can view your data and insights.
本ブログに掲載されている見解は著者に所属するものであり、必ずしも New Relic 株式会社の公式見解であるわけではありません。また、本ブログには、外部サイトにアクセスするリンクが含まれる場合があります。それらリンク先の内容について、New Relic がいかなる保証も提供することはありません。


