Quickstart
Comprehensive monitoring quickstart for Apache Flink
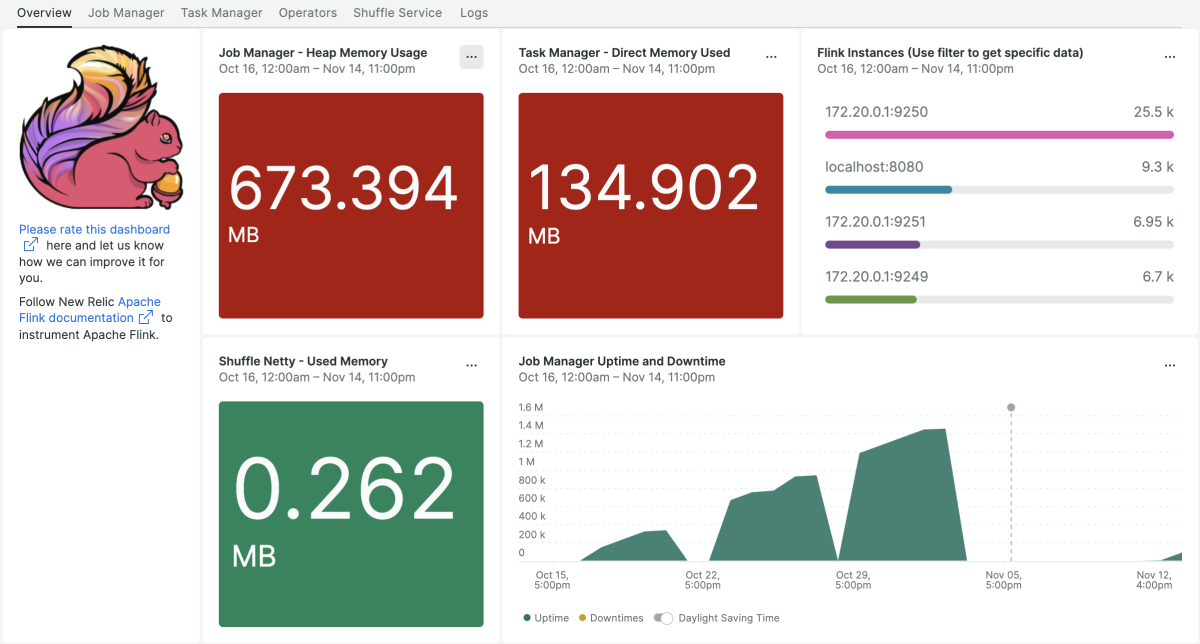
New Relic detects your Apache Flink metrics like job manager (checkpoints, direct, mapped, metaspace memory usage), task manager (shuffle service, operators), heap memory usage and more.
Why monitor Apache Flink?
An ideal Apache Flink performance monitoring provides an easy way for effective monitoring and alerting of your Apache Flink jobs.
Apache monitoring dashboards
New Relic's Apache Flink monitoring quickstart boasts instant full-stack observability out-of-the-box.
Our easy-to-use performance monitoring dashboards monitor metrics like:
- Heap memory usage
- Job manager uptime and downtime
- Used memory
- CPU time in seconds and CPU load
- Status of recent triggered checkpoints and those in progress
Apache Flink performance alerts
We’ve also created strategic alerts toproactively inform you about the status of your Apache Flink jobs.
These alerts include failed checkpoints, job manager heap memory usage higher than 10MB, task manager direct memory higher than 100MB, and shuffle service used memory greater than 2MB.
Need help? Visit our Support Center or check out our community forum, the Explorers Hub.


