Mule is the most popular open source Enterprise Service Bus (ESB). Incredibly useful as a message infrastructure for connecting services and applications, Mule ESB acts as a transit system that allows existing systems to communicate with each other regardless of transport protocol or location.
The platform is Java based and we are pleased to announce that the New Relic APM Java agent supports Mule ESB from version 3.4 up to the latest version, 3.8.
Mule ESB and flows
As an application container, Mule ESB provides an environment where applications can run. These applications, called “flows,” can perform many duties, including acting as an intermediary between systems, providing database access, handling HTTP requests, and interacting with data stores, external systems, and web services.
With the New Relic APM Java agent, you now have the ability to see flows run through their entire life cycle, see which flows and sub-flows are called, see synchronous and asynchronous work, view interactions with data stores such as Java Database Connectivity (JDBC) and Java Message Service (JMS), and see external calls and cross application tracing. In general, we provide insight into all aspects of a flow’s behavior and performance. Furthermore, since the Java agent already supports technologies like JDBC, JMS, Apache HttpClient, and other libraries used inside of Mule ESB, you should have a seamless experience drilling down the entire stack from request to response. Let’s explore some examples.
JDBC
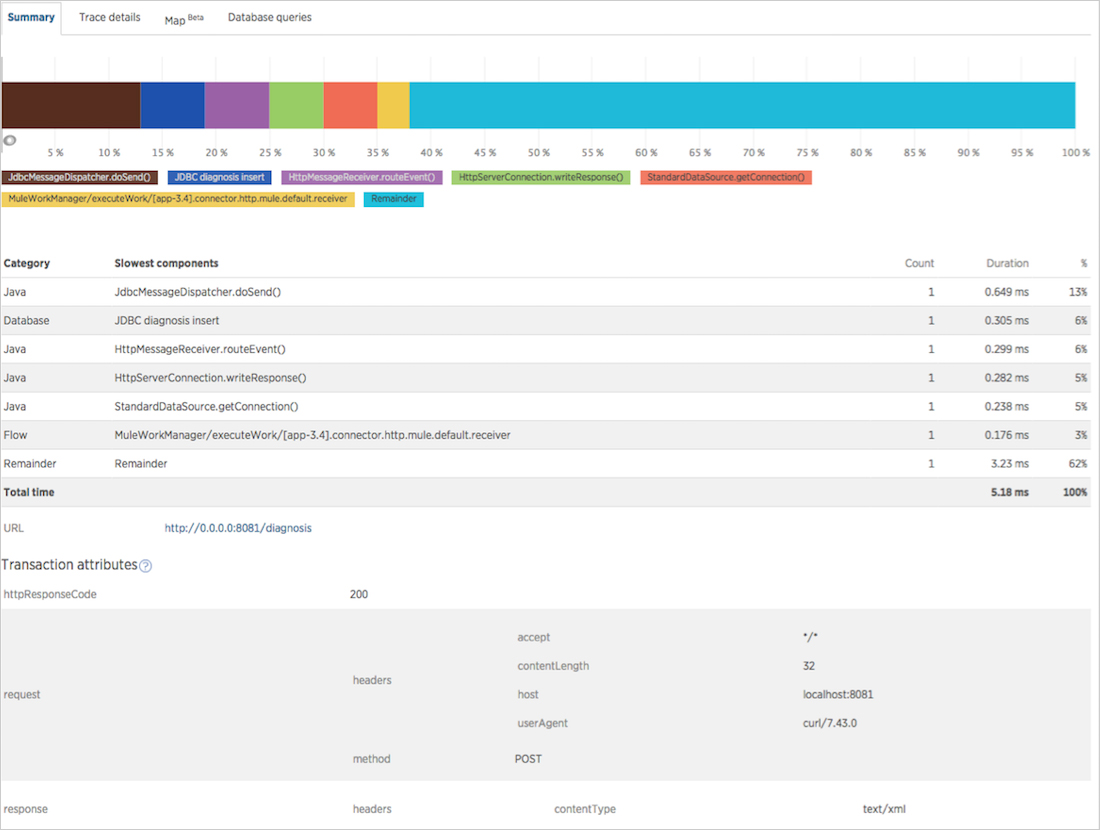
Here is the Summary of a Transaction Trace from a sample application named app-3.4, which receives an HTTP request to an endpoint named /diagnosis (a flow that uses JDBC to access a database), and then returns an HTTP response. You can see the app name, flow name, endpoint, HTTP request with headers, response, and how long the different parts of the transaction trace took to run:
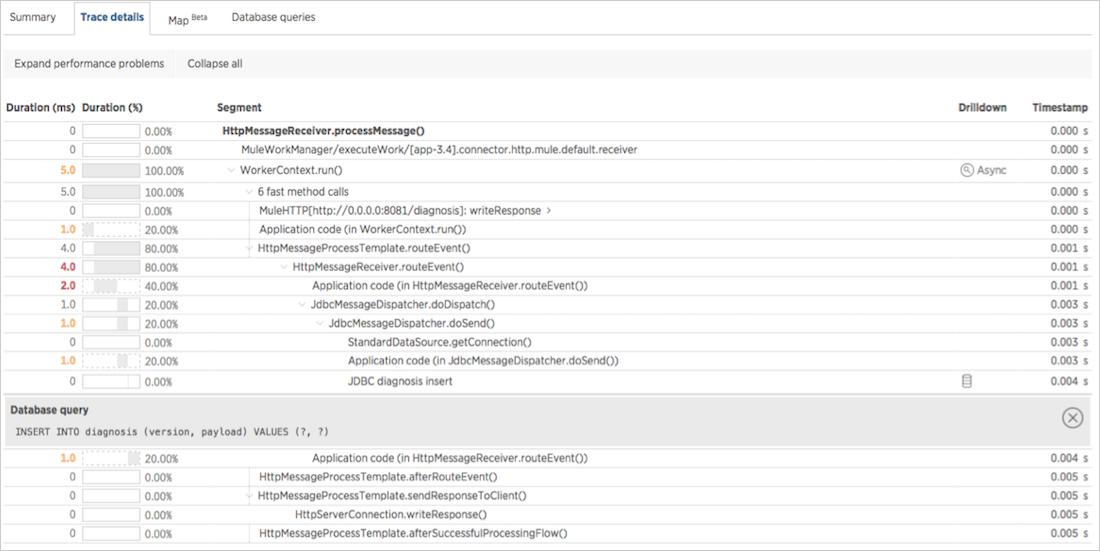
Switch to the Details view of the Transaction Trace to see all the pertinent information, or check out the Drilldown column to view asynchronous work that occurred and the JDBC call. Click on the database icon to see the query that was performed:
JMS
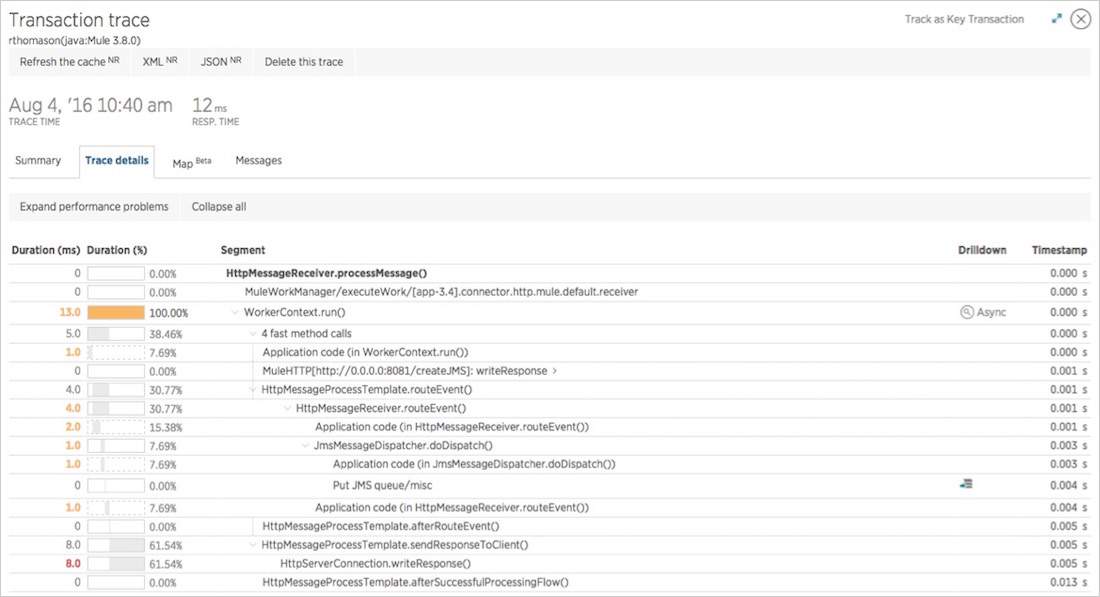
Here is another example in the same application that responds to an HTTP post and creates a JMS message in a queue named misc. The Details view of the Transaction Trace shows the entire flow creating the message and the JMS icon:
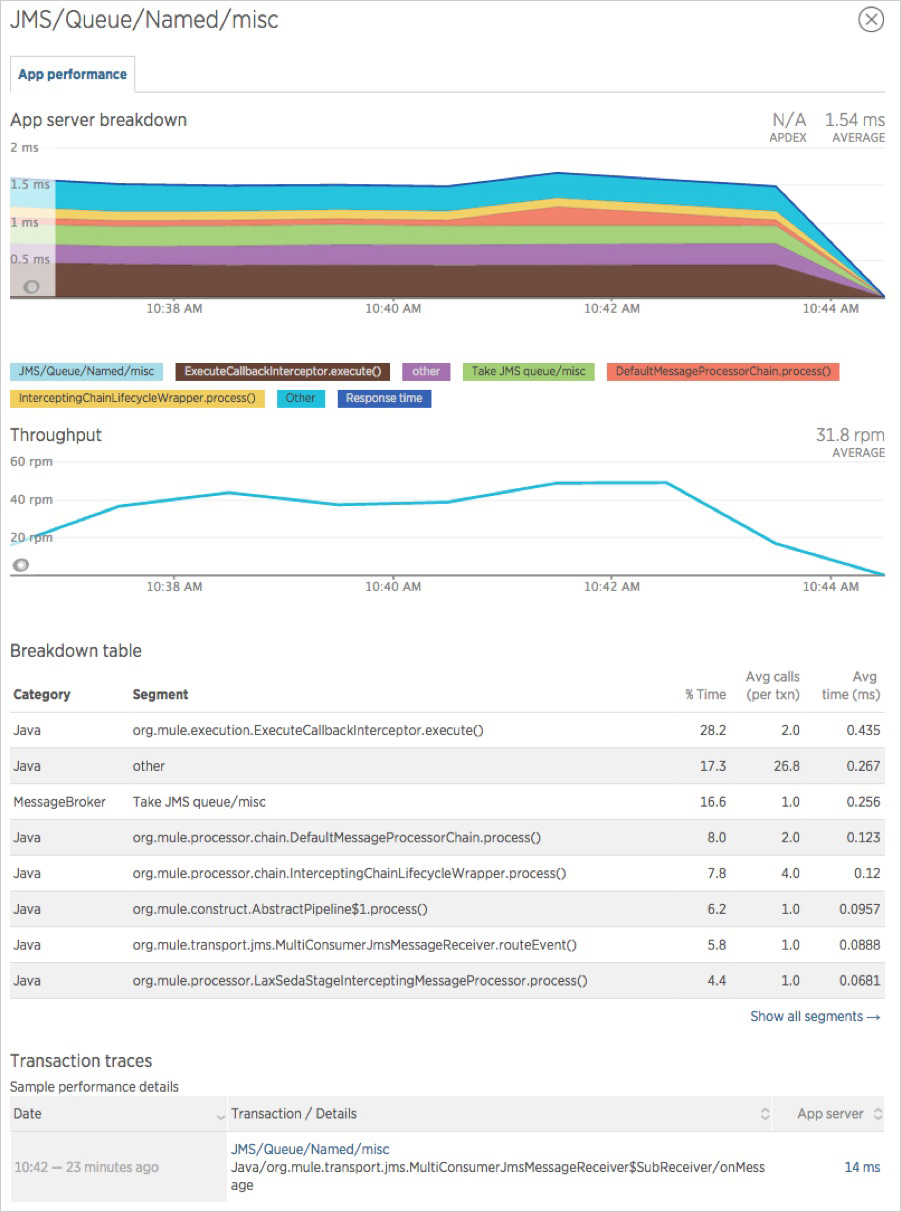
Click on the JMS icon to see details about this message queue, including how long creating the message took, and the request throughput:
Cross Application Tracing (CAT)
Finally, this example uses Cross Application Tracing (CAT) to make an external call to a Tomcat application that is also running the Java agent. Since this is an external call, the external call icon appears: ![]()
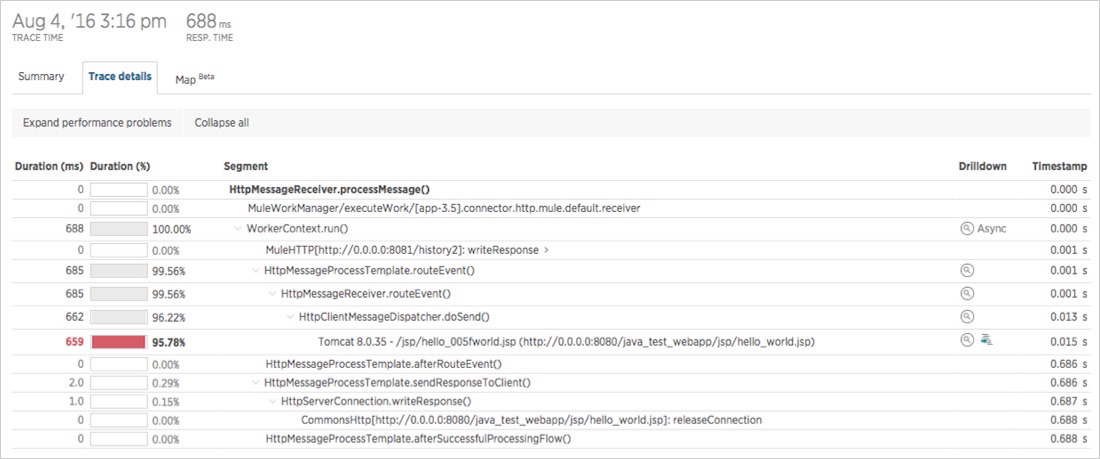
Our support for Mule ESB allows the New Relic Java agent to instrument both sides of this transaction. Following the external call icon takes you to the second application, with a link from the referring application, named Mule 3.8.0:
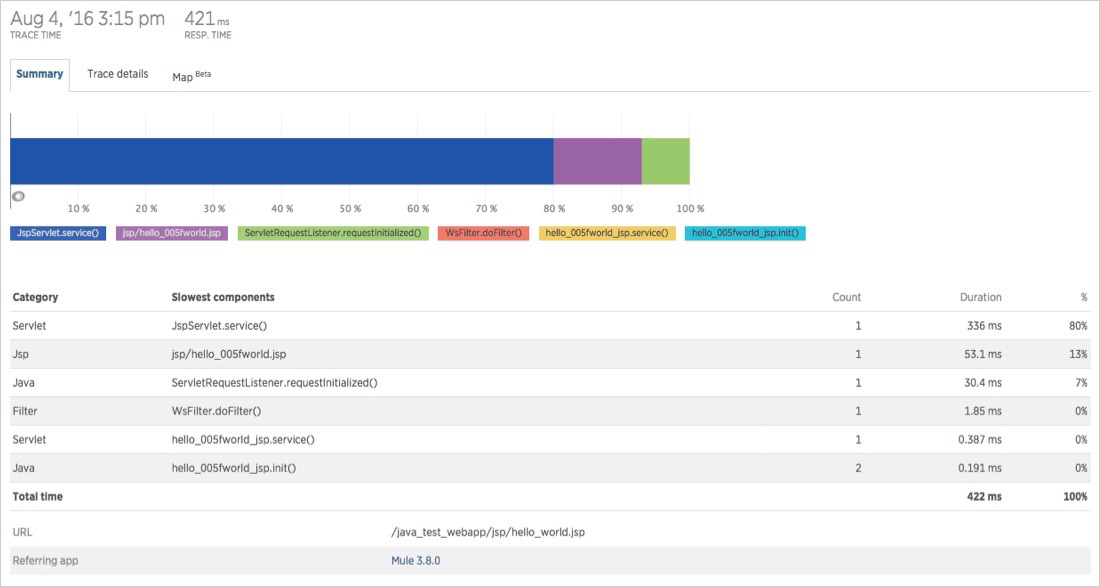
We believe that enabling you to tag and follow your transaction into the Mule ESB can be incredibly powerful!
Conclusion
New Relic is excited to provide this level of visibility and insight into Mule ESB. Whether your flows are synchronous or asynchronous, use HTTP Transport or HTTP Connector, interact with JDBC or JMS, or make internal or external calls, New Relic is designed to capture it all.
If you have questions, comments, concerns, or suggestions, please let us know in the Java agent thread on our community forum.
Die in diesem Blog geäußerten Ansichten sind die des Autors und spiegeln nicht unbedingt die Ansichten von New Relic wider. Alle vom Autor angebotenen Lösungen sind umgebungsspezifisch und nicht Teil der kommerziellen Lösungen oder des Supports von New Relic. Bitte besuchen Sie uns exklusiv im Explorers Hub (discuss.newrelic.com) für Fragen und Unterstützung zu diesem Blogbeitrag. Dieser Blog kann Links zu Inhalten auf Websites Dritter enthalten. Durch die Bereitstellung solcher Links übernimmt, garantiert, genehmigt oder billigt New Relic die auf diesen Websites verfügbaren Informationen, Ansichten oder Produkte nicht.


