Today, AWS launched the public preview of the AWS Distro for OpenTelemetry, a secure, production-ready open source distribution with predictable performance. As a top contributor to the OpenTelemetry project, our exporters are available today. We have begun joint testing with AWS and expect that our exporters will be included in the AWS Distro for OpenTelemetry when it becomes generally available. Users of AWS Lambda and Amazon Elastic Container Service (ECS) will have a streamlined path to instrument their applications with OpenTelemetry, and make that data immediately available within the New Relic One platform.
We’re excited to partner with AWS on AWS Distro for OpenTelemetry and to provide increased capabilities and scope to our users who instrument their applications using open standards.
New Relic is partnering with us in supporting AWS Distro for OpenTelemetry, with the goal of helping our customers achieve a standardized set of practices for collecting metrics and traces for modern applications running on AWS. Both teams are committed to offering a well-integrated and unified experience for customers who choose to instrument with OpenTelemetry. Among other AWS service integrations that New Relic supports, AWS Distro for OpenTelemetry will allow New Relic users to attain additional flexibility when consolidating logs, traces, and metrics across their software stack with other telemetry data sources.. —Mark Carter, General Manager, AWS.
OpenTelemetry is the standard at New Relic
OpenTelemetry standardizes instrumentation across your applications and services, which is essential for complete end-to-end visibility. Being an open standard, it also encourages broad collaboration among developers and fosters instrumentation ubiquity. We're standardizing our future observability offerings on OpenTelemetry, increasing our investments in the project to become a major contributor to the standard, and evolving our strategy to fully embrace open instrumentation. We’ll contribute our instrumentation to OpenTelemetry projects, including support for the hundreds of frameworks and libraries that provide you an unparalleled breadth of visibility. We’ve also taken a leadership role in OpenTelemetry metrics, contributing twelve years’ worth of experience to the metrics semantic specification, as we believe metrics are fundamental to understanding, monitoring, and observing the health and performance of a service.
Currently, we provide exporters for Java, Go, .NET, and the OpenTelemetry Collector to send telemetry data from your services to New Relic One, with other language exporters coming soon. Our fully managed, highly-scalable, and performant SaaS platform reduces the cost and operational burden of maintaining different systems for storing, querying, and visualizing data.
New Relic One now has a UI dedicated to providing full APM functionality for your OpenTelemetry data. With this curated experience, you can find the root cause of incidents quickly, and optimize the performance of your applications and services. Apart from the exporters, we’ll be providing pre-built OpenTelemetry integrations and continuously evolving our user experiences to ensure users can easily adopt OpenTelemetry.
Start exploring OpenTelemetry and New Relic
As OpenTelemetry and the AWS Distro for OpenTelemetry get closer to being generally available it is a good time to start experimenting with OpenTelemetry today. The best way to get started with OpenTelemetry is to try it out with your own applications and services to get value from the instrumentation right away, and you are using services with which you’re already familiar. Here is how you can auto-instrument your Java application to send telemetry data to New Relic:
java -javaagent:path/to/opentelemetry-auto-<version>.jar \

-Dotel.exporter.jar=path/to/opentelemetry-exporter-newrelic-auto-<version>.jar \


-Dotel.exporter.newrelic.api.key=INSERT_API_KEY \


-Dotel.exporter.newrelic.service.name=your-service-name \


-Dotel.exporter.newrelic.uri.override=https://trace-api.eu.newrelic.com/ \


-jar myapp.jar
If you don’t have an application to experiment with, you can also use our fork of the Online Boutique cloud-native microservices as your demo application. This application has two services instrumented with OpenTelemetry SDKs and the respective New Relic OpenTelemetry exporters: FrontEnd (in Go) and AdService (in Java).
Analyzing OpenTelemetry data in New Relic
Now that your application is sending OpenTelemetry data to New Relic, go to one.newrelic.com to visualize and analyze all your data.
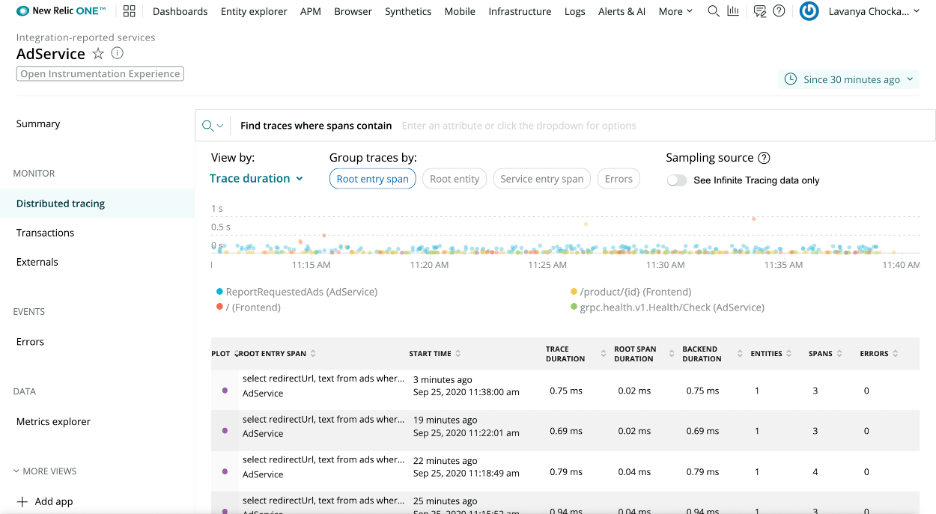
To find your spans, select distributed tracing from the home page or from within the service page. With distributed tracing, you can get an end-to-end view of a single request across your services.

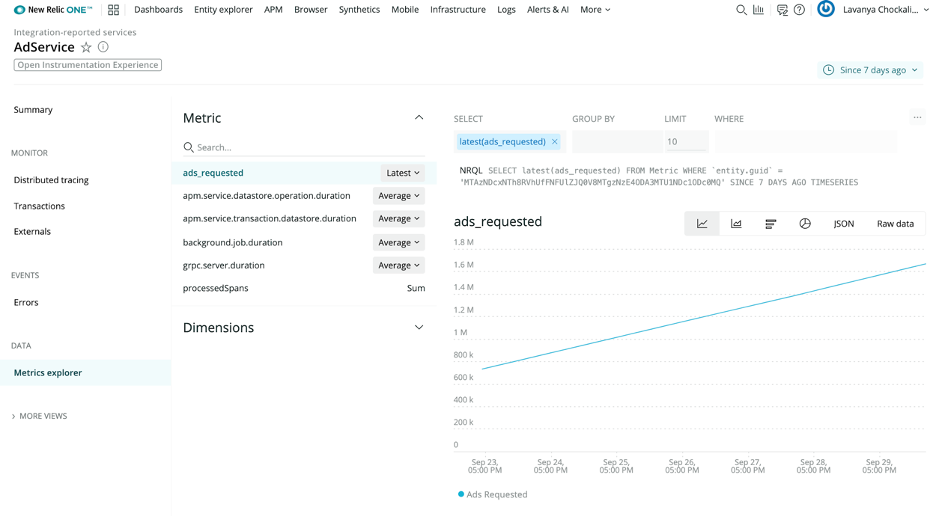
To view your metrics and create dashboards, use the metric explorer. You can also facet your metrics by various dimensions, view, and change the New Relic Query Language (NRQL) queries to create the charts as needed.

Checkout other key pages, such Summary, Transactions, and Externals, which will help you quickly discover the data that you need to root-cause and optimize the performance of your applications and services.
AWS, New Relic and OpenTelemetry—cloud observability simplified
The future of instrumentation is open. Both New Relic and AWS are committed to providing users with an easy path to adopt OpenTelemetry to capture and collect telemetry data.
As we actively work with AWS to get our exporters packaged into their distribution, we will also be continuously maturing OpenTelemetry support at New Relic. In the coming months, watch out for OpenTelemetry exporters for other programming languages, pre-built OpenTelemetry integrations as well as evolving user experiences.
With the AWS Distro for OpenTelemetry’s standardized instrumentation and New Relic One’s connected experiences AWS users get complete interoperability and simplified observability.
If you are interested in exploring OpenTelemetry, get started by signing up for New Relic’s free tier and using our OpenTelemetry exporters.
Die in diesem Blog geäußerten Ansichten sind die des Autors und spiegeln nicht unbedingt die Ansichten von New Relic wider. Alle vom Autor angebotenen Lösungen sind umgebungsspezifisch und nicht Teil der kommerziellen Lösungen oder des Supports von New Relic. Bitte besuchen Sie uns exklusiv im Explorers Hub (discuss.newrelic.com) für Fragen und Unterstützung zu diesem Blogbeitrag. Dieser Blog kann Links zu Inhalten auf Websites Dritter enthalten. Durch die Bereitstellung solcher Links übernimmt, garantiert, genehmigt oder billigt New Relic die auf diesen Websites verfügbaren Informationen, Ansichten oder Produkte nicht.


