Whether you’re managing Amazon EC2 instances or writing AWS Lambda functions, AWS X-Ray is a critical distributed tracing tool for getting visibility across your AWS services, but it doesn’t automatically capture all calls outside of AWS.
Conversely, New Relic distributed tracing provides automatic tracing for any application where the New Relic agent is installed—including on-prem and monolithic applications. One thing it lacked was visibility into trace and performance data from AWS-managed services where the agent couldn’t be installed.
As software organizations rapidly shift workloads to the cloud, resulting applications often run on anything from on-prem VMs to Functions as a Service (FaaS) platforms, with a variety of managed cloud services providing queues, API services, databases, load balancing, and more.
To put it simply, things get complicated quickly.
So how do you easily troubleshoot a modern application that includes AWS services alongside the rest of your stack?
Historically, solving this challenge required manually passing trace IDs between services to get a full view of your application performance. But that’s a time-consuming approach that often results in blind spots between AWS and the rest of your services.
Introducing our new AWS X-Ray integration
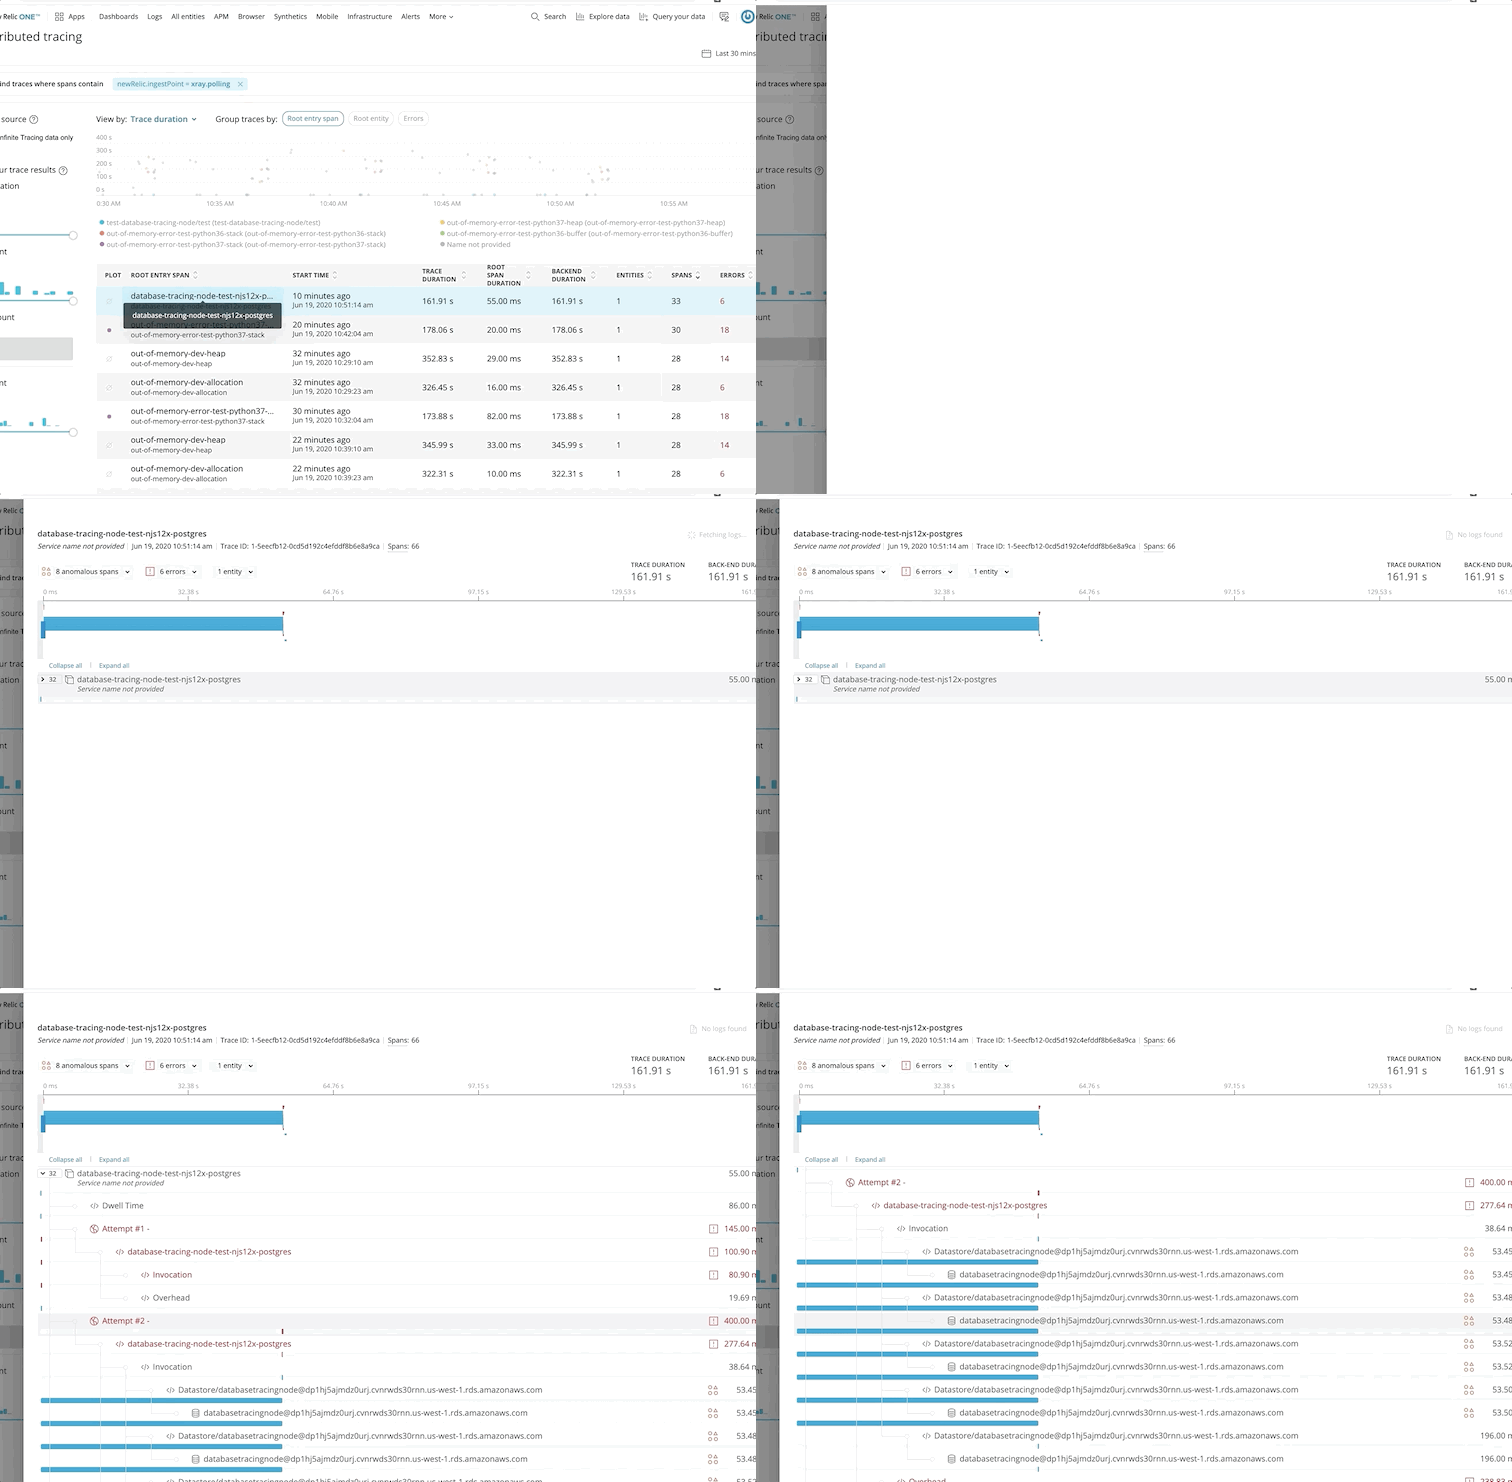
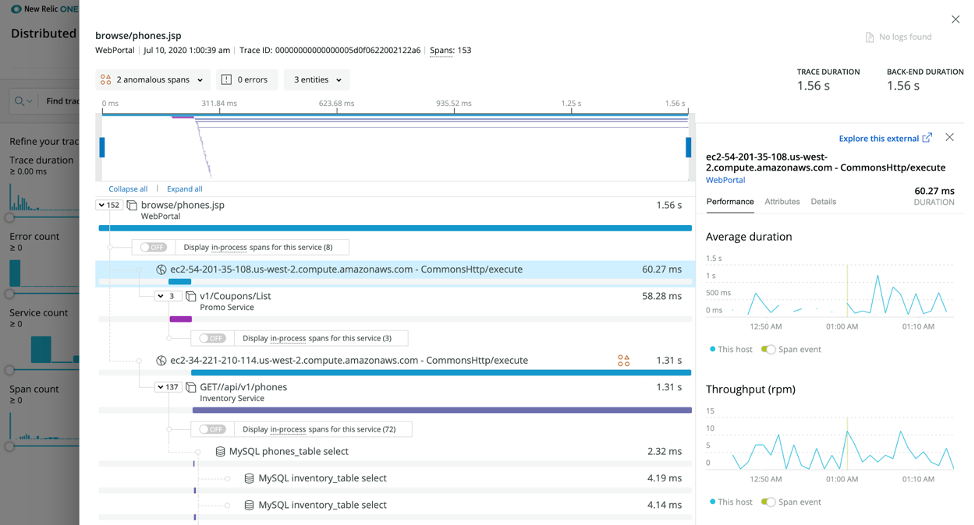
The New Relic AWS X-Ray integration finally addresses this problem by combining New Relic distributed tracing and X-Ray into an integrated experience. Now, you can see a view of requests as they travel through their applications, along with filtering, querying, and visualizing trace data to quickly debug issues.
Because this update brings rich trace data for AWS-managed services, it’s now easy to get insight into how services—like AWS Lambda, Amazon Simple Queue Service, Amazon API Gateway, or Amazon DynamoDB—are contributing to your total transaction time or possibly causing errors. This means transactions that happen inside AWS can be just as transparent as transactions within your own hosted environments.
"By integrating AWS X-Ray with New Relic, customers can get application trace data from managed AWS services and New Relic agents into a single debugging and triaging experience," says Nizar Tyrewalla, Sr. Product Manager for AWS X-Ray. "With this feature, developers and operators will be able to pinpoint services causing errors and performance bottlenecks, and resolve issues faster."
Get started with the New Relic AWS X-Ray integration for distributed tracing
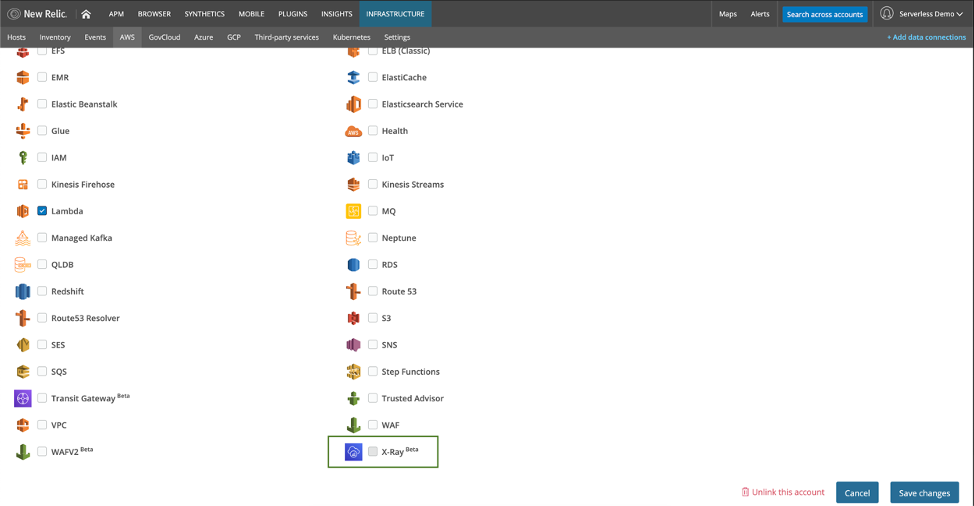
If you’re an existing New Relic user and you’ve already connected your AWS account, go to your New Relic Infrastructure AWS settings and activate X-Ray (see below).
 After you enable the X-Ray integration, AWS X-Ray trace data will display in any distributed tracing view throughout New Relic.
Next steps
To learn more about detecting and resolving issues across distributed systems spanning AWS services and traditional ecosystems, join us for our upcoming Morningstar, AWS, and New Relic webinar on July 28.
Die in diesem Blog geäußerten Ansichten sind die des Autors und spiegeln nicht unbedingt die Ansichten von New Relic wider. Alle vom Autor angebotenen Lösungen sind umgebungsspezifisch und nicht Teil der kommerziellen Lösungen oder des Supports von New Relic. Bitte besuchen Sie uns exklusiv im Explorers Hub (discuss.newrelic.com) für Fragen und Unterstützung zu diesem Blogbeitrag. Dieser Blog kann Links zu Inhalten auf Websites Dritter enthalten. Durch die Bereitstellung solcher Links übernimmt, garantiert, genehmigt oder billigt New Relic die auf diesen Websites verfügbaren Informationen, Ansichten oder Produkte nicht.


