The following post was originally published on December 11, 2018. It has been edited to ensure that all product references are accurate and up to date.
Kubernetes is a remarkable success story: A container orchestration technology that made its first public appearance barely three years ago now plays a pivotal role at thousands of organizations that have adopted container-based application architectures.
Perhaps the most amazing thing about Kubernetes, however, isn’t what it’s accomplishing today—it’s that we’re just getting started! If current trends hold, within a few more years we expect to see customers deploying container orchestration on a scale far surpassing how most organizations deploy it today.
The challenges of monitoring Kubernetes performance
Yet many customers are already dealing with the challenges of running Kubernetes environments at scale. They’re excited about the possibilities, but they’re also concerned about maintaining visibility into Kubernetes performance and health.
As a Kubernetes environment scales and becomes more complex, it gets harder to answer some very basic—but very important—questions: What is the health of my cluster? What is the hierarchy and the health of the elements (nodes, pods, containers, and applications) within my cluster? We think it’s essential for our customers to have the tools they need to get useful answers to these questions, so they can take a proactive approach to monitoring the health and performance of their Kubernetes environments—at any scale and any level of complexity.
There’s also the question of how teams can adapt and adjust their troubleshooting processes as a Kubernetes environment continues to scale. It can already be difficult to untangle the dependencies between applications and infrastructure; or to drill down into and navigate all of the entities—containers, pods, nodes, deployments, namespaces, and so on—that may be involved in a troubleshooting effort. As complexity increases, so does the effort and expense required to find and fix problems—ideally before they impact customers.
Introducing the solution: Kubernetes cluster explorer
Based on these challenges operations and development teams require better ways to visualize and explore the health of their Kubernetes environments. We're addressing this need with an innovative new curated-visualization tool: New Relic's Kubernetes cluster explorer.

Cluster explorer expands the Kubernetes monitoring capabilities already built into the New Relic platform. It applies advanced capabilities to filter, sort, and search for Kubernetes entities; to understand the relationships and dependencies within an environment; and then employs data-visualization techniques that give customers a fast and intuitive path to getting answers and understanding their Kubernetes environments. It’s a powerful and innovative solution to the challenges associated with running Kubernetes at massive scale.
Many teams were already trying to address these challenges on their own—typically with some combination of siloed products, Kubernetes dashboards, and homegrown scripts piecing together different components. But these solutions typically lack cohesion, show little correlation, and may be accessible to only a handful of engineers within an organization.
When your team adopts cluster explorer, you can expect quicker resolutions when troubleshooting errors, along with improved performance and consistency, and an effective way to contain the complexity associated with running Kubernetes at scale. New Relic can help ensure that your clusters are running as expected and quickly detect performance issues within your cluster—even before they have a noticeable impact on your customers.
Improved views into Kubernetes health and performance
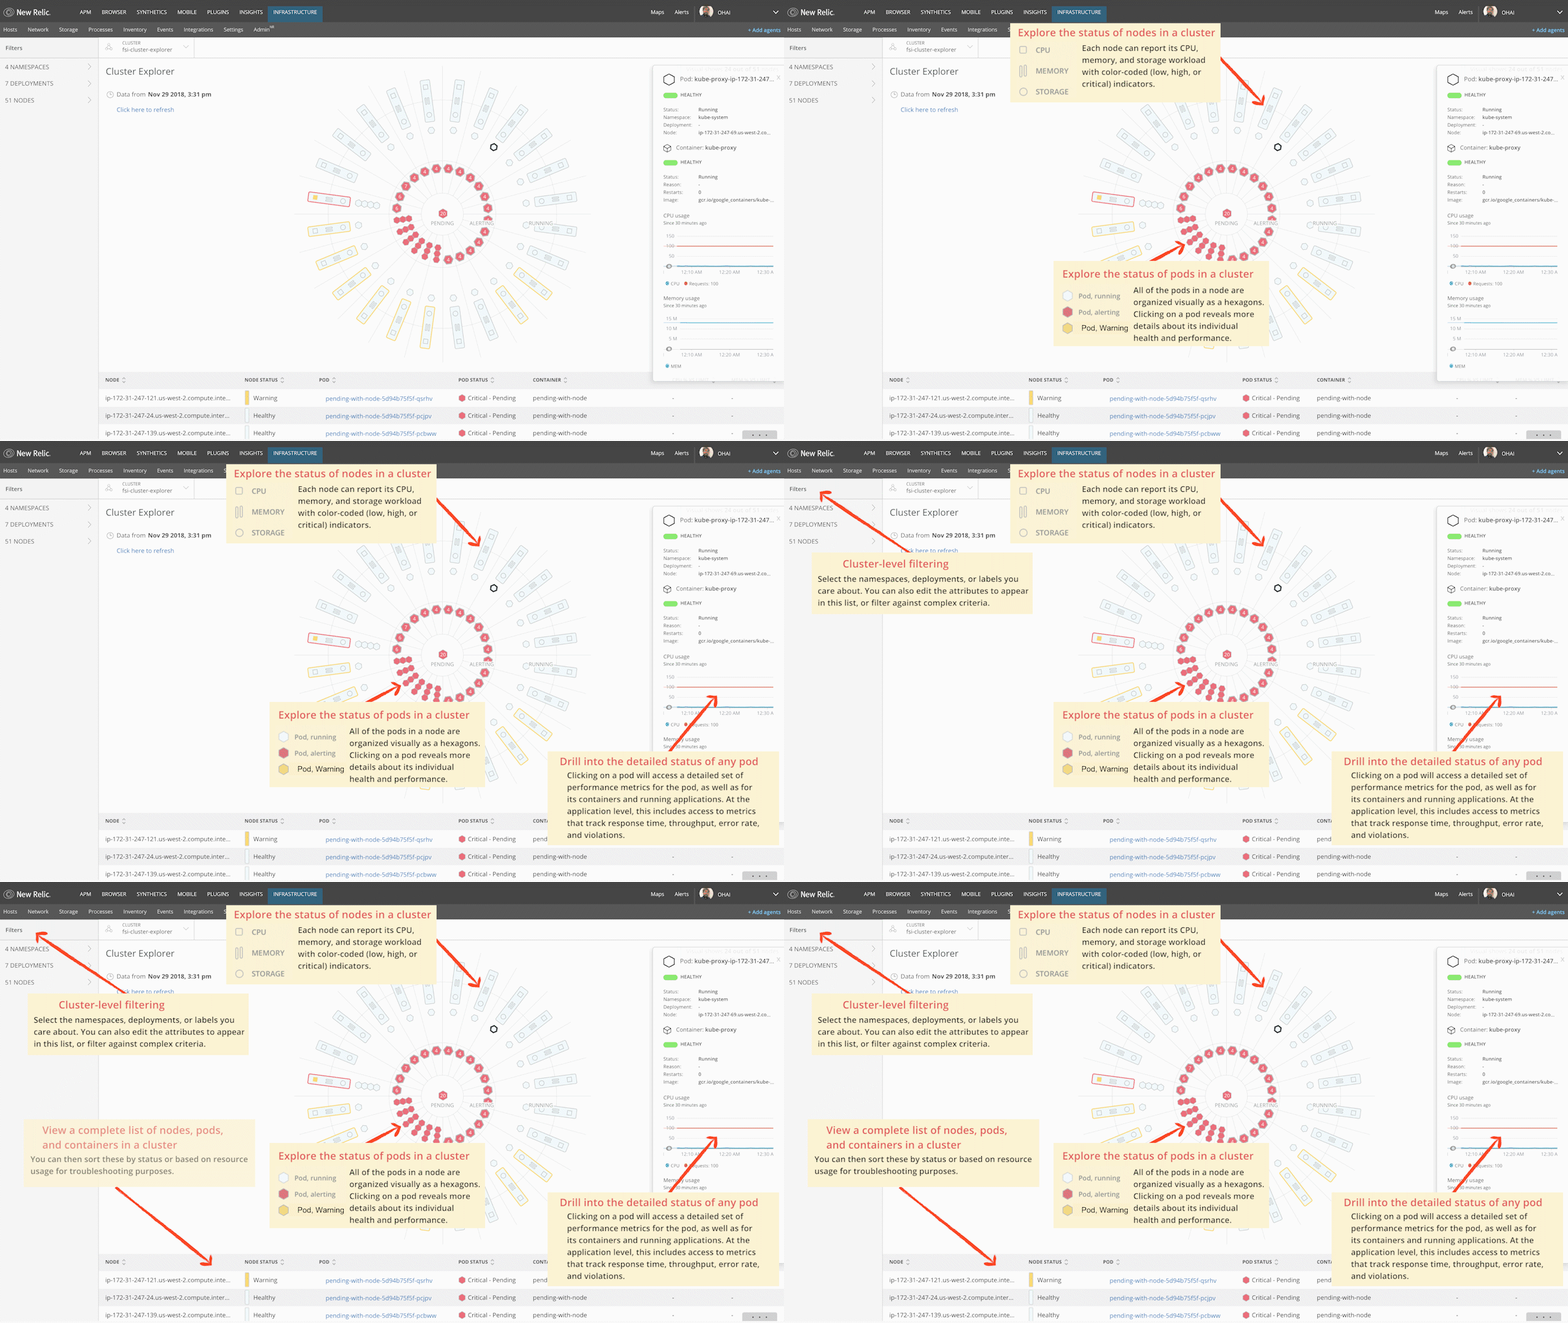
The cluster explorer provides a multi-dimensional representation of a Kubernetes cluster that allows teams to drill down into Kubernetes data and metadata in a high-fidelity, curated UI that simplifies complex environments. Teams can use cluster explorer to observe performance and dependencies across any Kubernetes environment, and to troubleshoot failures, bottlenecks, and other abnormal behavior—helping ensure that their applications are always available, running fast, and doing what they’re supposed to do.
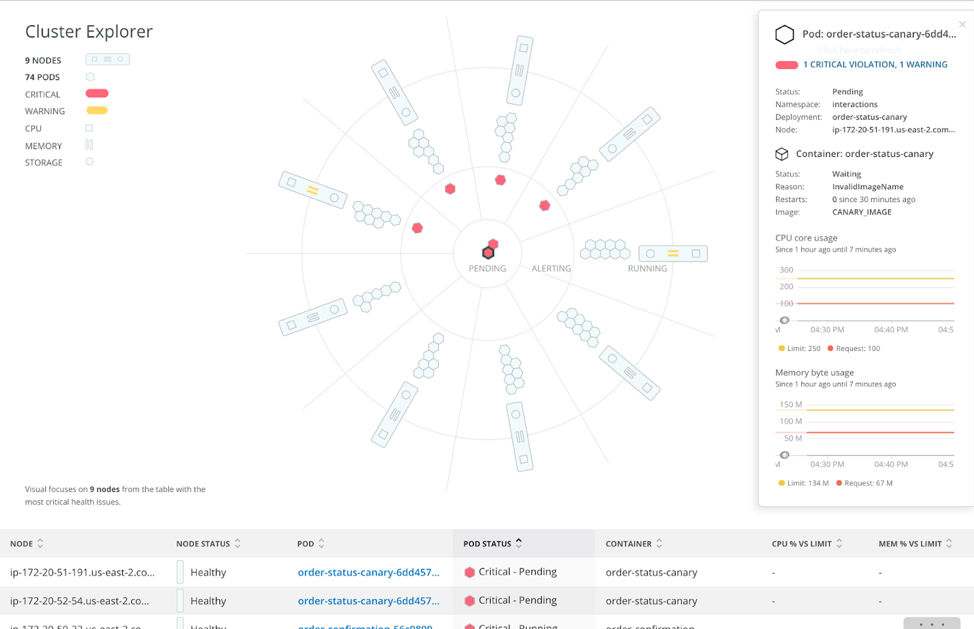
The cluster explorer employs a distinctive design that shows the entire cluster but that can easily shift its focus to hotspots within the cluster—with the most critical elements appearing in the middle. It visualizes the cluster as a series of four concentric rings:
- The outer ring shows the nodes of the cluster, with each node displaying CPU, memory, and storage performance metrics that provide at-a-glance understanding of the node’s overall health.
- The next ring reveals information about the distribution and status of the pods associated with a selected node.
- The third ring displays pods that have breached an alerting threshold—indicating that these pods may have health issues even if they are still running.
- Finally, the inner ring displays pods that are not running or that Kubernetes is unable to schedule—due to a lack of resources, for example, or because the wrong container image was specified.

Faster and more effective troubleshooting
At New Relic, we know how important it is for customers to understand the health and performance status of their Kubernetes entities. A team may, for example, want to spot-check the health of an environment during peak business hours or before assigning a deployment or a namespace to a team. These are critical times for spotting Kubernetes performance and health trends that may indicate potential problems—and, ideally, to find and fix these problems before they degrade a customer’s digital experience.
It’s also important to recognize that a global view into a Kubernetes environment is a necessary but not sufficient troubleshooting capability. Teams also need to identify the dependencies or details of a failure, and then navigate efficiently through a cluster to the source of the problem—diving deeper, as needed, from node to pod to container to application.
Consider this common example: an alert notification that triggers a troubleshooting effort. A team might begin by using cluster explorer to get a global view of a Kubernetes cluster and to understand key relationships (such as between a node and a pod). The team can then focus its efforts by diving into one or more pods—observing the health and performance of individual containers and the applications they serve—and by quickly narrowing their view to focus on the Kubernetes namespace or deployment. The team can also use cluster explorer to correlate application and infrastructure behavior, such as cases where high application throughput generates high container CPU usage. Another use case is to identify hot spots where pod instances from one replica set are concentrated on a host—a situation that can be remediated with anti-affinity rules.
The cluster explorer experience: something for everyone
No matter what role you play on a team that manages a Kubernetes environment, there’s something very powerful about using simple and intuitive visual cues to get high-level visibility into system performance and health.
Developers may use cluster explorer to disentangle and discover correlations between applications and infrastructure: Does application latency indicate errors within the application, or is it actually the result of low memory at the node, pod, or container level? For developers, the Kubernetes cluster explorer provides increased visibility into all of your Kubernetes objects (clusters, nodes, namespaces, deployments, replica sets, pods, and containers) running within your application. This helps you understand the behavior of your application, as well as analyze failures and optimize performance. We want developers to be able to spend more time building applications—and less time instrumenting and managing their Kubernetes environments.
An operations team, meanwhile, might want to focus on questions about resilience and reliability: Is a Kubernetes environment responding well to a peak-period surge in demand, or is it showing application/infrastructure trends that point to a potential problem? Operators get an overall view of the health of each cluster, and they can drill down as needed for details on the state of a Kubernetes object, including a view of key metrics and logs. All of these capabilities support a proactive approach to monitoring your Kubernetes environment—avoiding problems whenever possible, and troubleshooting problems more effectively when issues do occur.
The curated user experience and visualizations in cluster explorer are both powerful and flexible—creating value for different team members in different ways in a variety of situations. We believe that many of the capabilities in cluster explorer set new standards for the industry, including multi-dimensional view of pods and nodes, with critical performance status and health metrics rolled into a single visual summary; or the ability to drill down almost instantly into relevant and highly detailed low-level metrics. Cluster explorer also breaks ground with its ability to display application and infrastructure metrics and objects side by side, scoped to the context of a specific Kubernetes node, pod, or container, or of a specific application transaction trace.
Ready to get started with Cluster Explorer?
We want to get as many New Relic customers as possible working with Kubernetes cluster explorer. That's why we make cluster explorer available to any New Relic Infrastructure Pro customer who has configured the New Relic Kubernetes monitoring integration—there’s nothing extra to deploy or to configure. Find out more in our Kubernetes monitoring integration documentation.
With tools such as Kubernetes cluster explorer, New Relic is dedicated to ensuring that massive scalability will be a key opportunity for teams that use Kubernetes—not a source of pain and inconvenience. We’re excited to deliver this ground-breaking capability, and hope that it serves you well, today and in the future.
Die in diesem Blog geäußerten Ansichten sind die des Autors und spiegeln nicht unbedingt die Ansichten von New Relic wider. Alle vom Autor angebotenen Lösungen sind umgebungsspezifisch und nicht Teil der kommerziellen Lösungen oder des Supports von New Relic. Bitte besuchen Sie uns exklusiv im Explorers Hub (discuss.newrelic.com) für Fragen und Unterstützung zu diesem Blogbeitrag. Dieser Blog kann Links zu Inhalten auf Websites Dritter enthalten. Durch die Bereitstellung solcher Links übernimmt, garantiert, genehmigt oder billigt New Relic die auf diesen Websites verfügbaren Informationen, Ansichten oder Produkte nicht.


