Whether you’ve been immersed in the world of software observability for years or are newer to it, chances are you’ve heard of OpenTelemetry, widely regarded in the industry as the open standard for instrumentation. In either case, understanding the OpenTelemetry Collector is a crucial piece to utilizing OpenTelemetry to its full potential and getting the most out of your application and system data.
What’s the Collector? It’s an executable file that can collect and modify telemetry, then send it to one or more backends, including New Relic. It provides a highly configurable and extensible way to handle observability data within modern cloud-native environments. Given its range of telemetry-processing superpowers, there’s understandably a lot to learn about it!
In this blog post, we’ll demystify the Collector by discussing key fundamentals, including its architecture, deployment methods, and configuration, as well as how to monitor it, to help you get started with this versatile tool.
Architecture and configuration
The Collector was designed to be modular, with customizable data pipelines for your traces, logs, and metrics–this is what makes it so configurable. At the bare minimum, you need a data pipeline component that receives your app data, and another that ships it to a backend for analysis; these are the only two “required” Collector components. As you build out your Collector, you can add components that enhance, filter, and batch your data.
There are four pipeline components that access your data:
- Receivers: Ingest data from your app and/or system.
- Processors: Modify the data in some way.
- Exporters: Send the data to your designated backends.
- Connectors: Enable you to send data between your pipelines.
There are also extension components, which handle tasks that don’t directly access your data, such as Collector health checks and service discovery.
Let’s check out a sample Collector configuration to help you understand its architecture and how data flows through it. First, you configure the components you’d like to use. In the following example, we’ve configured at least one component for each data pipeline, as well as a few extensions:
receivers:
  otlp:
    protocols:
      grpc:
      http:

exporters:
  otlp:
    endpoint: https://otlp.nr-data.net:4317
    headers:
      api-key: YOUR_LICENSE_KEY


processors:
  batch:

connectors:
  spanmetrics:

extensions:
  health_check:
  pprof:
  zpages:
Next, you have to enable the components by including them in the service section as appropriate; otherwise, they won’t be used. In the following sample config, we’ve configured data pipelines for each of our data types: traces, metrics, and logs (note that extension components are enabled under extensions):
service:
extensions: [health_check, pprof, zpages]
pipelines:
traces:
receivers: [otlp]
processors: [batch]
exporters: [otlp, spanmetrics]
metrics:
receivers: [otlp, spanmetrics]
processors: [batch]
exporters: [otlp]
logs:
receivers: [otlp]
processors: [batch]
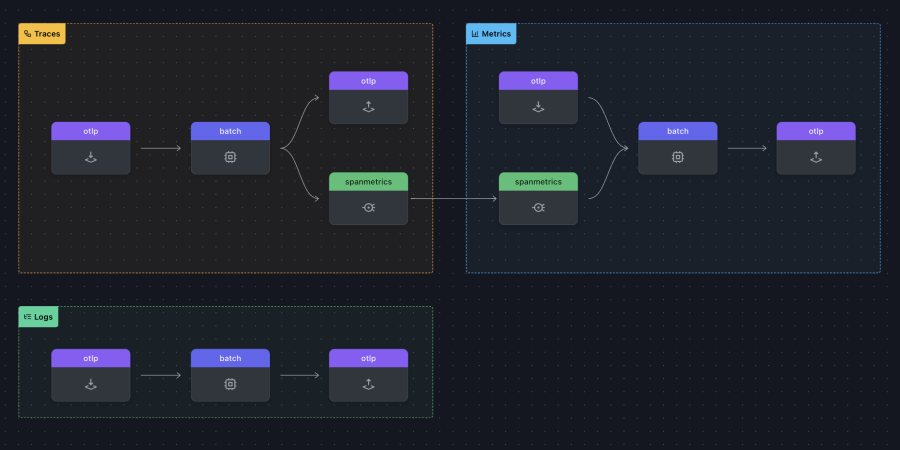
exporters: [otlp]Let’s use the traces pipeline to understand how the data pipelines work: the otlp receiver ingests trace data from your app, then the data makes it into the processor pipeline, where it’s compressed by the batch processor and then sent to the last piece of the pipeline, the exporters. Here, the batched traces are shipped by the otlp exporter to your New Relic account, and by the spanmetrics connector to the metrics pipeline, where it’s received and processed by the spanmetrics connector.
The Collector is able to receive data in different formats, from a variety of sources, and over different protocols. Similarly, it’s able to export data in different supported formats; New Relic supports OpenTelemetry data natively, which means you can just use the otlp exporter to send your traces, metrics, and logs to your account.
You can also define multiple otlp exporters if you want to send your data to multiple backends, or use other exporters as needed. For example, you can use the debugexporter to output telemetry data to your console for debugging purposes.
Connectors are optional, and technically so are processors, but there are a couple of processors that are recommended by the OpenTelemetry community:
- memorylimiterprocessor, which helps prevent out-of-memory situations on the Collector.
- batchprocessor, which compresses your data and reduces how many outgoing connections are needed to transmit your data.
There are more than 30 other processors you can use to further enhance or modify your data, such as the tailsamplingprocessor to sample your traces based on specified criteria, and the redactionprocessor to comply with legal, privacy, or security requirements. Note that the order of processors in your pipelines matters; for example, you’d want to define the batchprocessor after any sampling or initial filtering processors, since you’d only want to batch your sampled traces.
The best practice for ordering your processors is as follows:
- memorylimiterprocessor
- Sampling and initial filtering processors
- Processors that rely on sending source from Context
- batchprocessor
- Remaining processors
If you’ve configured multiple components and want to make sure you’ve enabled them, you can validate your configuration. One option is to run otelcol validate --config=customconfig.yaml. Alternatively, you can use OTelBin. See the following screenshot for a validated example of our previous config example (it’s also a simple visualization of the data flowing through the pipelines):

Deployment options
Following its configuration versatility, you can install the Collector on various operating systems and architectures, including Docker, Kubernetes, Linux, macOS, and Windows. The simplest deployment is a single Collector instance, but there are a number of deployment patterns you can employ to fit your business needs and telemetry use cases.
Generally, the Collector can be deployed as:
- A gateway, in which your services report data to a centralized Collector before being sent to a backend (for instance, your New Relic account).
- An agent, in which it runs on the same host as your service and can collect infrastructure telemetry about said host; it can send data directly to a backend or to a gateway Collector.
Distros
There are two official distributions, or distros, of the Collector: core and contrib. The core distro is the minimal, stable version that contains just the essential components required for collecting, processing, and sending your data. It’s designed to be lightweight and efficient, which makes it suitable for most standard use cases and environments.
The contrib distro extends the core distro with additional dozens of components, and as such, provides you with a broader range of capabilities for your data. While it includes more features and integrations, the components are at varying levels of maturity, so you’ll want to keep that in mind if you plan on using it in production.
If you want the best of both worlds, or otherwise need something altogether different, you also have the option to build your own Collector distro. If you want to build and debug custom pipeline components or extensions, you’ll also need your own Collector instance, which will enable you to launch and debug your components in your preferred Golang IDE. To do this, you’d use the OpenTelemetry Collector Builder (ocb), which was built by the community to simplify the process and allows you to include your custom components and also use core or contrib components.
Monitoring the Collector
Since you’re depending on the Collector to handle and process your data, it makes sense that you’d want to monitor its health and performance. This will also help you identify any issues, such as resource constraints and potential security vulnerabilities. Some key metrics to monitor include the following:
- Resource utilization metrics, such as CPU and memory usage.
- Performance metrics, such as processing latency, dropped data, and batch sizes and processing rates.
- Operational metrics, such as uptime and availability, and error rates.
You can use the Collector’s own internal telemetry to monitor it. There are two de facto ways in which the Collector exposes its telemetry: basic metrics, which are exposed via a Prometheus interface (you can configure how these internal metrics are generated and exposed), and logs, which are emitted to stderr (you can also configure these logs). To learn more about best practices on how to monitor your Collector with its internal telemetry, check out this documentation.
Nächste Schritte
If you’re eager to get some hands-on experience with the Collector, the New Relic fork of the OpenTelemetry demo app is a great place to start. It includes a default Collector config that you can easily customize to experiment with various pipeline components. If you’d like to learn more about the fork, as well as how to deploy it on Kubernetes using Helm, check out Running the OpenTelemetry community demo app in New Relic.
If you’d like to get additional support, or to get in touch with the Collector Special Interest Group (SIG), the #otel-collector channel in CNCF’s Slack instance is an effective option, or you can hop into one of their weekly SIG meetings (Wednesdays, alternating between 09:00 PT, 05:00 PT, 17:00 PT). You can also reach New Relic’s OpenTelemetry engineers in #otel-newrelic if you have questions related to your OpenTelemetry data in the New Relic platform.
If you’d like to contribute to the Collector by working on open issues, perusing the “good first issue” list on the GitHub repositories is a solid starting point.
To learn more about the Collector, check out the following resources:
Die in diesem Blog geäußerten Ansichten sind die des Autors und spiegeln nicht unbedingt die Ansichten von New Relic wider. Alle vom Autor angebotenen Lösungen sind umgebungsspezifisch und nicht Teil der kommerziellen Lösungen oder des Supports von New Relic. Bitte besuchen Sie uns exklusiv im Explorers Hub (discuss.newrelic.com) für Fragen und Unterstützung zu diesem Blogbeitrag. Dieser Blog kann Links zu Inhalten auf Websites Dritter enthalten. Durch die Bereitstellung solcher Links übernimmt, garantiert, genehmigt oder billigt New Relic die auf diesen Websites verfügbaren Informationen, Ansichten oder Produkte nicht.


