Debugging Kubernetes can be stressful and time-consuming. This blog post walks through some common errors at the container, pod, and node level so you can apply these tips to help your clusters run smoothly. Whether you’re new to Kubernetes or have been using it for a while, you’ll learn a comprehensive set of tools and methods for debugging Kubernetes issues.
This post is part three in a Monitoring Kubernetes series that explains everything you need to quickly set up your Kubernetes clusters and monitor them with New Relic.
- In part one, you learned that Kubernetes automates the mundane operational tasks of managing containers.
- In part two, you learned how to optimize Kubernetes for your application's needs
We’ll build on the previous parts, diving into a wide range of topics, from understanding the basics of pods and containers to advanced troubleshooting techniques.
Troubleshooting every level of your Kubernetes deployment
Starting at the top: Troubleshooting your nodes
If you want to know the health of your entire Kubernetes cluster, you'll want to know a few things:
- How are the nodes in the cluster working
- At what capacity are your nodes running?
- How many applications running on each node?
- What isresource utilization of the entire cluster?
You can get all of these metrics and more by running this command:
kubectl top nodeThe output of kubectl top node includes metrics on the number of CPU cores and memory utilized, as well as overall CPU and memory utilization. This is a critical first step in troubleshooting as it allows you to see the current state of your infrastructure.
How to troubleshoot Kubernetes pods
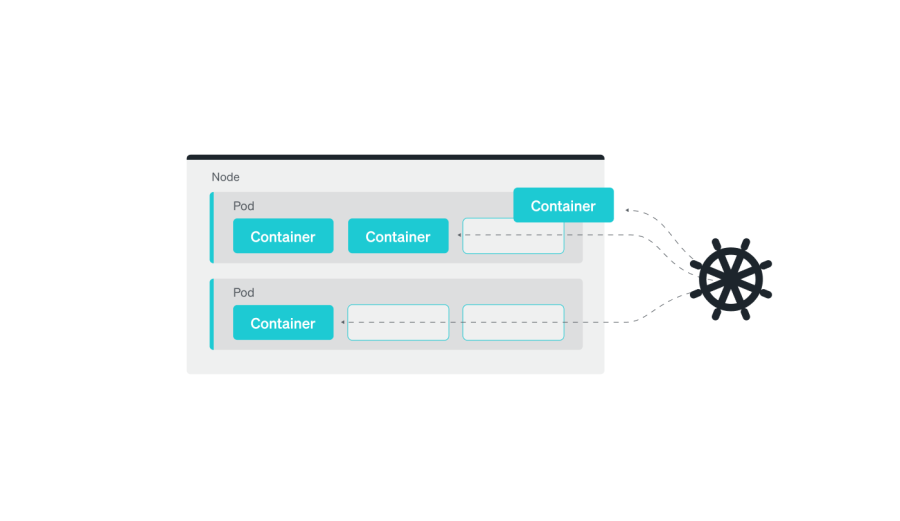
In Kubernetes, a pod is the smallest and simplest unit in the object model. It represents a single process running in a cluster. While a pod is the smallest unit in the Kubernetes object model, it can hold one or more containers, and these containers share the same network namespace, meaning they can communicate with each other using localhost. Pods also have shared storage volumes, so all containers in a pod can access the same data.
Guide to pod states
Pods have various states, including running, pending, failed, succeeded, and unknown.
- The running state means that the pod's containers are running and healthy.
- The pending state means that the pod has been created but one or more of its containers are not yet running.
- The failed state means that one or more of the pod's containers has terminated with an error.
- The succeeded state means that all containers in the pod have terminated successfully. And the Unknown state means that the pod's state cannot be determined.
To get the state of your pods, you can use the kubectl get pods command in your terminal. The output displays the current state of all pods in the current namespace. By default, it shows the pod name, the current state (for example, running, pending, and so on), the number of containers, and the age of the pod.
kubectl get podsYou can use the -o wide option to get even more information on each pod, such as the IP address and hostname.
kubectl get pods -o widePods also generate events that can provide valuable information about their status. You can view events by using the kubectl describe command to get more detailed information about the pod, including its current state, its IP address, and the status of its containers.
This is useful for understanding why a pod is in a particular state. For example, an event might indicate that a pod was evicted due to a lack of resources, or that a container failed to start due to an error in the application code.
kubectl describe pod <pod-name>You can also filter the pods based on their state, for example, to check all the running pods, you can use this command:
kubectl get pods --field-selector=status.phase=RunningAdditionally, you can use kubectl top pod command to get the resource usage statistics for the pods.
kubectl top podAre you currently running a Kubernetes cluster? If so, try using some of these commands to see what output you get.
Common pod errors
Now that you know the current state of your pods, this section introduces common issues with Kubernetes resources (Pods, Services, or StatefulSets). We’ll cover how to make sense of, troubleshoot, and resolve each of these common issues.
Although there are more issues you can encounter when working with Kubernetes, the list in this section includes the most common instances you’ll encounter.
Use this list to jump directly to the section about these common issues:
- CrashLoopBackOff error
- ImagePullBackOff/ErrImagePull error
- OOMKilled error
- CreateContainerConfigError and CreateContainerError
- Pods are stuck in pending or waiting
CrashLoopBackOff error
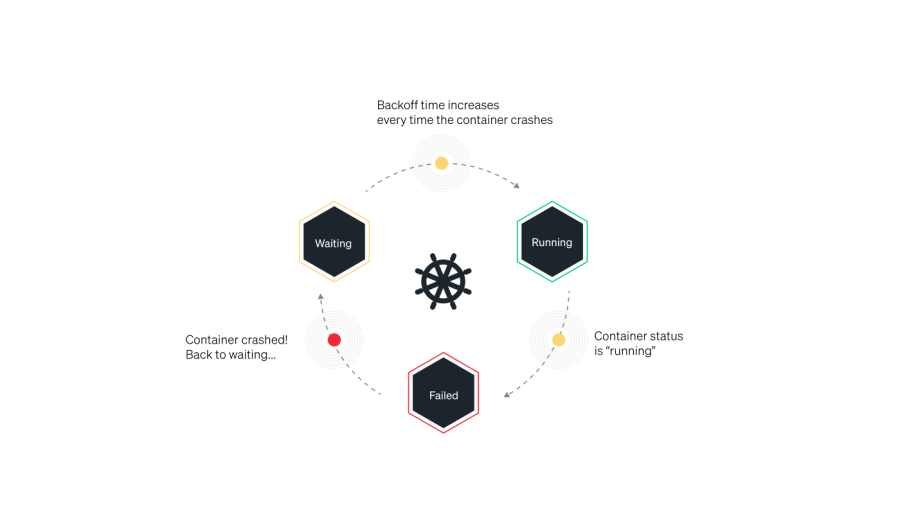
One of the most common errors you’ll encounter while working with Kubernetes is the CrashLoopBackOff error. This error occurs in Kubernetes environments typically when a container in a pod crashes and the pod's restart policy is set to Always. In this scenario, Kubernetes will keep trying to restart the container, but if it continues to crash, the pod will enter a CrashLoopBackOff state.
How to identify a CrashLoopBackOff error
- Run
kubectl get pods. - Check the output to see if…
- The pod’s status has a
CrashLoopBackOfferror. - There is more than one restart.
- Pods aren't identified as ready.
This example shows 0/1 as ready, 2 restarts, and has a status of CrashLoopBackOff.
$ kubectl get pods
NAME                 READY   STATUS               RESTARTS   AGE
example-pod           0/1    CrashLoopBackOff     2          4m26s
What causes a CrashLoopBackOff error?
A CrashLoopBackOff status in the STATUS column isn't the root cause of the problem—it simply indicates that the pod is experiencing a crash loop. To effectively troubleshoot and fix the issue, you'll need to identify and address the underlying error that’s causing the containers to crash.
There are several possible causes for the CrashLoopBackOff error:
- The container might be running out of memory or CPU resources. You can verify this by checking the resource usage of the container and pod using
kubectlcommands. - The container might be unable to start due to an issue with the image or configuration. For example, the image might be missing a required dependency, or the container might not have the necessary permissions to access certain resources.
- The container might be crashing due to a bug in the application code. In this case, the logs of the container might provide more information about the cause of the crash.
- The container might be crashing due to a network issue, for example, the container might be unable to connect to a required service.
Troubleshooting a CrashLoopBackOff error
Once you identify the particular pod that is showing the CrashLoopBackOff error, follow these steps to identify the root cause.
1. Run this command:
kubectl describe pod [name]2. If the pod is failing due to a liveness probe failure or a back-off restarting failed container error, the command will provide valuable insights.
From       Message
-----      -----
kubelet    Liveness probe failed: cat: can’t open ‘/tmp/healthy’: No such file or directory
kubelet    Back-off restarting failed container
3. If you get back-off restarting failed container, and Liveness probe failed error messages, it’s likely that the pod is experiencing a temporary resource overload caused by a spike in activity.
To resolve this issue, you can adjust the periodSeconds or timeoutSeconds parameters to give the application more time to respond. This allows the pod to recover.
ImagePullBackOff/ErrImagePull error
In a Kubernetes cluster, there’s an agent on each node called the kubelet that’s responsible for running containers on that node. If a container image doesn’t already exist on a node, the kubelet will instruct the container runtime to pull it.
When a Kubernetes pod encounters an issue with pulling an image, it will initially generate an ErrImagePull error. The system will then retry a few times to download the image before ultimately "pulling back" and scheduling another attempt. With each unsuccessful attempt, the delay between retries increases exponentially, with a maximum delay of five minutes.
The ImagePullBackOff and ErrImagePull errors in Kubernetes environments typically occur when the Kubernetes node is unable to pull the specified image from the container registry. This can happen for several reasons:
- The image might not exist in the specified container registry, or the image name might be misspelled in the pod definition.
- The image might be private, and the pod doesn’t have the necessary credentials to pull it.
- The pod's network might not have access to the container registry.
- The pod might not have enough permissions to pull the image from the container registry.
How to Identify an ImagePullBackOff error
1. Run kubectl get pods
2. Check the output to see if the pod’s status has an ImagePullBackOff error:
$ kubectl get pods
NAME                 READY   STATUS             RESTARTS   AGE
example-pod           0/1    ImagePullBackOff   0          4m26s
How to Troubleshoot an ImagePullBackOff error
To troubleshoot the ImagePullBackOff error, first run kubectl describe. Review the specific error under events. Take these recommended actions for each of the errors:
Repository does not exist or no pull access- This means that the repository specified in the pod doesn’t exist in the Docker registry the cluster is using.
- By default, images are pulled from Docker Hub, but your cluster might be using one or more private registries.
- The error might occur because the pod does not specify the correct repository name, or doesn’t specify the correct fully qualified image name (for example username/imagename).
- Another reason for this error might be DockerHub or another container registry’s rate limits prevent the kubelet from fetching the image.
Manifest not found- This means that the specific version of the requested image was not found. If you specified a tag, this means the tag was incorrect.
- To resolve it, double-check that the tag in the pod specification is correct and that it exists in the repository. Keep in mind that tags in the repo might have changed. If you didn’t specify a tag, check if the image has a latest tag. If you don’t specify a valid tag, the images that don't have a latest tag won’t be returned.
Authorization failed- In this case, the issue is that the credentials you provided can’t access the container registry or the specific image you requested.
- To resolve this, create a Kubernetes Secret with the appropriate credentials, and reference it in the pod specification. If you already have a Secret with credentials, ensure those credentials have permission to access the required image or grant access in the container repository.
OOMKilled error
In Kubernetes, kubelets running on your virtual machines (VMs) have something called a Memory Manager that tracks memory usage for various processes, including out-of-memory (OOM) issues. When the VM comes close to running out of memory, the Memory Manager kills the least amount of pods to free up enough memory to prevent the entire system from crashing.
There are two different scenarios that cause a OOMKilled Error.
1. The pod was terminated because a container limit was reached.
The Container Limit Reached error is specific to a single pod. When Kubernetes detects that a pod is using more memory than its set limit, it will terminate the pod with the error message OOMKilled - Container Limit Reached.
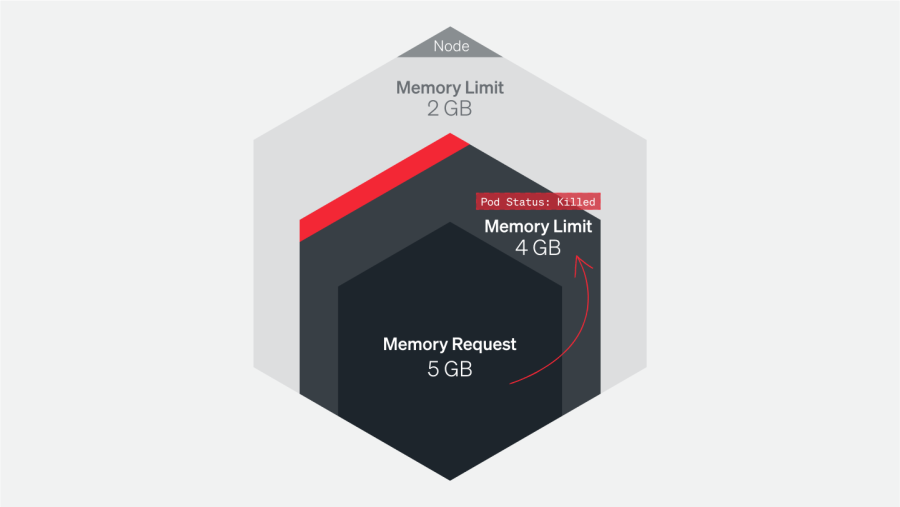
To troubleshoot this error, it's important to check the application logs to understand why the pod was using more memory than its set limit. This could be due to a spike in traffic, a long-running Kubernetes job, or a memory leak in the application.
Investigate! If you find that the application is running as expected and simply requires more memory to operate, consider increasing the values for the request and limit for that pod. Monitoring the resource usage and performance of the pod, and of the cluster, can also help you identify the problem, and find a way to prevent it in the future.
2. The pod was terminated because the node was “overcommitted”
The pods were scheduled to the node that, put together, request more memory than is available on the node.
The OOMKilled: Limit Overcommit error can occur when the aggregate memory requirements of all pods on a node exceeds the available memory on that node. You might recall seeing this issue in Part 2 of this series.
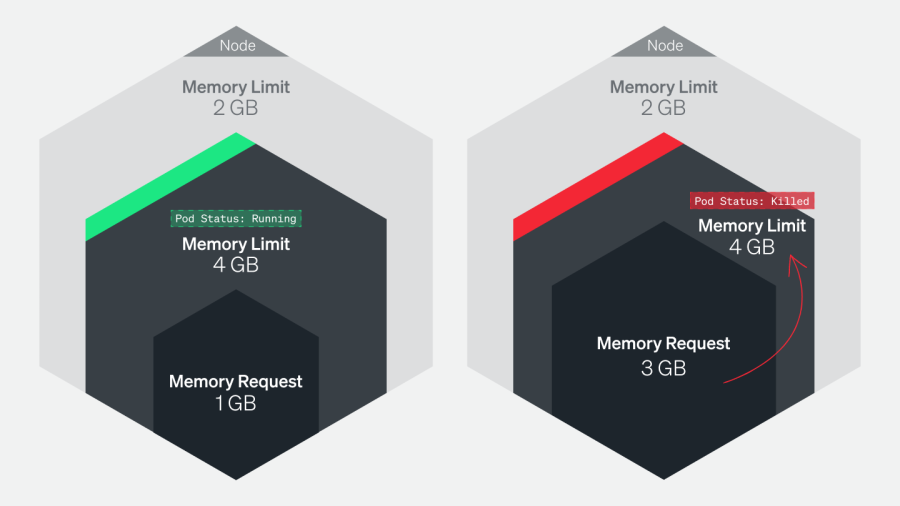
For example, let’s imagine you have a node with 5 GB of memory, and you have five pods running on that node, each with a memory limit of 1 GB. The total memory usage would be 5 GB, which is within the limit. However, if one of those pods is configured with a higher limit of, say 1.5 GB, it can cause the total memory usage to exceed the available memory, leading to OOMKilled error. This can happen when the pod experiences a spike in traffic or an unexpected memory leak, causing Kubernetes to terminate pods to reclaim memory.
It's important to check the host itself and ensure that there are no other processes running outside of Kubernetes that could be consuming memory resources, leaving less for the pods. It's also important to monitor memory usage and adjust the limits of pods accordingly.
How to identify an OOMKilled error
1. Run kubectl get pods
2. Check the output to see if the pod’s status has an OOMKilled error.
$ kubectl get pods
NAME                 READY   STATUS           RESTARTS   AGE
example-pod           0/1    OOMKilled        0          4m26s
How to troubleshoot an OOMKilled error
How you respond to an OOMKilled error depends on why the pod was terminated. It might have been terminated because of a container limit or an overcommitted node.
If the pod was terminated because of a container limit
To resolve the OOMKilled: Container Limit Reached error, it's important to first determine if the application truly requires more memory. If the application is facing increased load or use, it might require more memory than was originally allocated. In this scenario, you can increase the memory limit for the container in the pod specification to address the error. You can check if this is the case by getting the logs for the particular pod: run kubectl logs pod-name and determine if there is a noticeable spike in requests.
But if the memory usage unexpectedly increases and doesn’t appear to be related to application demand, it could indicate that the application is experiencing a memory leak. In this case, you need to debug the application and identify the source of the memory leak. Simply, increasing the memory limit in the application without addressing the underlying issue might result in a situation that just consumes more resources without solving the problem. It’s important to address the root cause of the leak to prevent it from happening again.
If the pod was terminated because of an overcommitted node
Pods are scheduled on a node based on their memory request value compared to the available memory on the node. But this can result in overcommitment of memory. To troubleshoot and resolve OOMKilled errors caused by overcommitment, it's important to understand why Kubernetes terminated the pod. Then you can adjust the memory limits and requests to ensure that the node is not overcommitted.
To prevent these issues from happening, it is important to monitor your environment constantly, understand the memory behavior of pods and containers, and regularly check your settings. This approach can help you identify potential issues early on and take appropriate action to prevent them from escalating. Having a good understanding of the memory behavior of your pods and containers—and knowing the settings you have configured—allows you to easily diagnose and resolve Kubernetes memory issues.
CreateContainerConfigError and CreateContainerError
The CreateContainerConfigError and CreateContainerError in Kubernetes typically occur when there’s a problem creating the container configuration for a pod. Some common causes include:
- An invalid image name or tag: Make sure that the image name and tag specified in the pod definition are valid and can be pulled from the specified container registry.
- Missing image pull secrets: If the image is in a private registry, make sure that the necessary image pull secrets are defined in the pod definition.
- Insufficient permissions: Ensure that the service account used by the pod has the necessary permissions to pull the specified image from the registry.
How to identify a CreateContainerConfigError or CreateContainerError
Run kubectl get pods
2. Check the output to see if the pod’s status is CreateContainerConfigError:
$ kubectl get pods
NAME                 READY   STATUS                       RESTARTS   AGE
example-pod           0/1    CreateContainerConfigError   0          4m26s
How to Troubleshoot a CreateContainerConfigError or CreateContainerError
1. Check the pod definition for any errors or typos in the image name or tag. If the image does not exist in the specified container registry, it’s going to throw this error.
2. Make sure that the specified image pull secrets are valid and exist in the namespace. Also make sure that the service has the necessary permissions to pull the specified image from the registry. You can run the kubectl auth can-i command to check if a service account has the necessary permissions to perform a specific action. For example, use the this command to check if a service account named my-service-account can pull the NGINX image from the NGINX repository:
kubectl auth can-i pull nginx --as=system:serviceaccount:<namespace>:my-service-accountReplace <namespace> with the namespace where the service account is located. If the command returns yes, the service account has the necessary permissions to pull the NGINX image. If it returns no, the service account doesn't have the necessary permissions.
3. Check the Kubernetes logs for more information about the error.
4. Use the command kubectl describe pod <pod-name> to get more details about the pod and check for any error messages.
Pods are stuck in pending or waiting
In part 2, we discussed how to “rightsize” your workloads with requests and limits. But what happens if you don’t rightsize correctly? Your pods’ status might be stuck in pending or waiting—because they aren’t able to be scheduled onto a node.
Pods are stuck in pending
Look at the describe pod output, in the Events section. Look for messages that indicate why the pod couldn’t be scheduled. Examples include:
- The cluster might have insufficient CPU or memory resources. This means you’ll need to delete some pods, add resources on your nodes, or add more nodes.
- The pod might be difficult to schedule due to specific resources requirements. See if you can release some of the requirements to make the pod eligible for scheduling on additional nodes.
Pods are stuck in waiting
If a pod’s status is waiting, this means it is scheduled on a node, but unable to run. Run kubectl describe <podname> and in the Events section look for reasons the pod can’t run.
Most often, pods are stuck in waiting status because of an error when fetching the image. Check for these issues:
- Ensure the image name in the pod manifest is correct.
- Ensure the image is really available in the repository.
- Test manually to see if you can retrieve the image. Run a
docker pullcommand on the local machine to ensure that you have the appropriate permissions.
Kubernetes troubleshooting with New Relic
The troubleshooting process in Kubernetes is complex. Without the right tools, debugging can be stressful, ineffective, and time-consuming. Some best practices can help minimize the chances of things breaking down, but eventually something will go wrong—simply because it can.
You can use New Relic as a single source of truth for all of your observability data. It collects all of your metrics, logs, and traces from every part of your Kubernetes stack, from the applications themselves, to the Kubernetes components, all the way down to the infrastructure metrics of your VMs.
Nächste Schritte
If you're ready to try monitoring Kubernetes in your own environment, sign up for a New Relic account today. Your free account includes one user with full access to all of New Relic, unlimited basic users who are able to view your reporting, and 100 GB of data per month.
If you're ready to try things out, try out our pre-built dashboard and set of alerts for Kubernetes.
Don’t have an environment to get started with? Spin up this demo application locally to get comfortable using the skills discussed in this guide.
Die in diesem Blog geäußerten Ansichten sind die des Autors und spiegeln nicht unbedingt die Ansichten von New Relic wider. Alle vom Autor angebotenen Lösungen sind umgebungsspezifisch und nicht Teil der kommerziellen Lösungen oder des Supports von New Relic. Bitte besuchen Sie uns exklusiv im Explorers Hub (discuss.newrelic.com) für Fragen und Unterstützung zu diesem Blogbeitrag. Dieser Blog kann Links zu Inhalten auf Websites Dritter enthalten. Durch die Bereitstellung solcher Links übernimmt, garantiert, genehmigt oder billigt New Relic die auf diesen Websites verfügbaren Informationen, Ansichten oder Produkte nicht.

