For our team of three at Koneksa, research and discovery drive our approach to add observability and instrumentation to our overall infrastructure. Our agile approach means we’re flexible to support the larger teams we work with. Because our team is small, we need the right tools and services to grow and scale. Measuring the value of tools or projects is also important: how often developers log in, how often they join in discussions, and how often they ask questions about how to do things. This is why we decided to adopt Kubernetes and Pixie as we migrated to microservices, and why we moved back from serverless to host.
At Koneksa, data is huge. The Koneksa platform is a full-service, one-stop shop for remote data collection, from trial design up to completion. The Koneksa platform enables clinical trial participants to continuously collect health data from the comfort of their homes. One of our initial challenges with data was understanding user patterns. A clinical trial could have many participants, and if those participants are on the same schedule, their uploaded data will have a burst-like quality that we need to be able to handle. We had to understand: What would happen to the system, and how would he handle the spike in load if all the participants completed their study tasks at once?
Moving back from serverless to self-managed nodes—and why
The Koneksa platform is a SaaS platform that can be configured to remotely collect patient-generated data during clinical studies. This can range from monthly questionnaires that participants submit through the Koneksa mobile application to continuous raw accelerometer data collection using a wrist-worn device. Initially, our platform was running on six Amazon EC2 instances. The whole stack was Node.js running directly on those virtual machines. We needed to break the distributed monolith in order to scale our architecture, but we didn't have much container expertise.
Very slowly, we decided to introduce containers into the engineering stack. First, we had an opportunity to implement a one-off AWS Fargate job that was queued by a process running on an EC2 instance via the Amazon Elastic Container Service (ECS) API. This gave us a taste of one of the promises that serverless provided—the ability to scale without worrying about configuring the underlying host. We then took our distributed monolith of six EC2 instances and migrated them to Fargate.
As we grew and our data throughput demands increased, we were thankful that we were able to scale with tools like Fargate. But cost became a consideration. Cost from a dollar perspective was there, but there was also the cost from the overhead of sidecars.
When we left EC2 instances, we were also leaving the ease of host-level monitoring. Running host integrations is a different world than running an integration sidecar for every app container in Fargate. We would be spending a higher percentage of the tasks, CPU, and memory on integrations like New Relic and other security tools, rather than on the platform application itself. While we love what serverless allowed us to do, there came a time in our stack where we needed to reduce the individual integration overhead and standardize our deployments, and we knew Kubernetes could help us accomplish that.
Things are just more standard with the Kubernetes API. Host monitoring was easily configurable, and it applied to all of our pods. That observability view—CPU, memory, latency, and other metrics—for our services is also critical, so we can see CPU and memory alongside our API. We couldn’t see that on serverless. We only had CloudWatch metrics because the overhead of the sidecars was too high in some cases, which meant that we couldn’t drill into metrics for a specific container. Once we had the metrics for the host, engineers were able to improve their application performance monitoring (APM) and have more confidence in what was going on with their services. The move to host gave us correlation and the ability to see everything in the context of our applications.
Why we landed on an open source solution with Kubernetes and Pixie
When we were building out our Kubernetes solution, we decided to explore the Cloud Native Computing Foundation (CNCF) landscape and consider all of the open source projects available to us. Both ArgoCD and various eBPF integrations caught our eye. You have to be resolute in a space that’s changing so quickly, so we were critical but determined in what we felt was right to adopt early.
We really liked what we saw when we looked at eBPF and Pixie around 2020. So when Pixie was integrated into the New Relic platform, we did a proof of concept. We saw tracing that was showing pod relations—you didn’t have to write it yourself. We saw the degree of monitoring we could get. Engineers had a better ability to troubleshoot issues themselves without getting the platform team involved, which was the goal.

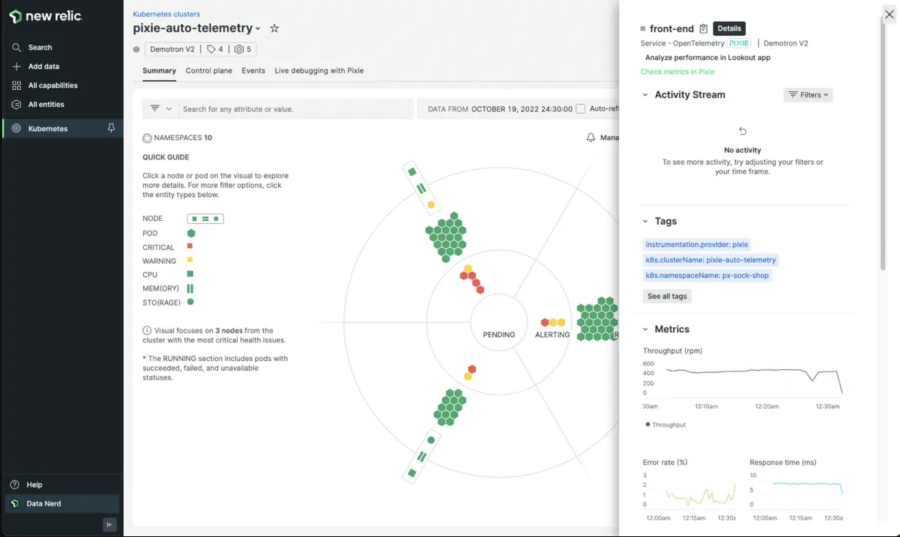
The pod details page in the Kubernetes cluster explorer shows application metrics collected by Pixie.
The first time you see the classic observability view, with nodes and hosts, it makes an impression. You begin to contextualize what it would look like in your own environment. For us, getting those pod-specific CPU memory metrics from Pixie, outside of CloudWatch, without the need to run a sidecar, was huge. That’s when engineers had the ability to troubleshoot issues in real time. Engineers could see if a load was not being distributed properly, or if they were throttling on CPU, or maxing out other requirements. It is very intuitive on the Pixie side. We can go into the issues live when we need to. We can go in and see which service is making the most requests, which HTTP path is the slowest, or which Golang stacktrace is causing issues. We’ve even worked with Pixie maintainers at New Relic to troubleshoot and debug.
When we moved from the traditional server to the Kubernetes side, we didn’t know what was gonna break. When we implemented New Relic Kubernetes—Kubernetes can get really chatty—we had to really think about what we wanted. As a business, we can't have nodes going down. We need to know how to filter the noise. We asked ourselves a few things: What do we really need to know? Is a container failing? Is a pod failing? Are there enough resources to spin up more pods?
We’re always pushing the limits on things, so we really use the grease that Pixie gives us. With New Relic, we get a lot of detailed information on how to optimize Kubernetes, make it more stable, avoid failures, and see what is happening. Pixie gives us the Linux Kernel data level that was not available before. When we saw that, it was one of those “aha” moments. We could see everything coming in and out. We could see that everything is working how it was supposed to. That helped us optimize our overall rollout of Kubernetes.
In New Relic, there’s some really good out-of-the-box Kubernetes stuff we built on top of. We customized an alert for when pods are missing from a deployment. Out of the gate, we saw what we could get, such as anomaly detection. We created Slack channels to manage alerts. We separated AI-driven alerts into one channel, so anyone in the company could go there and look at what had happened. We also created a learning channel for our team, which we used to test different alerting strategies along the way.

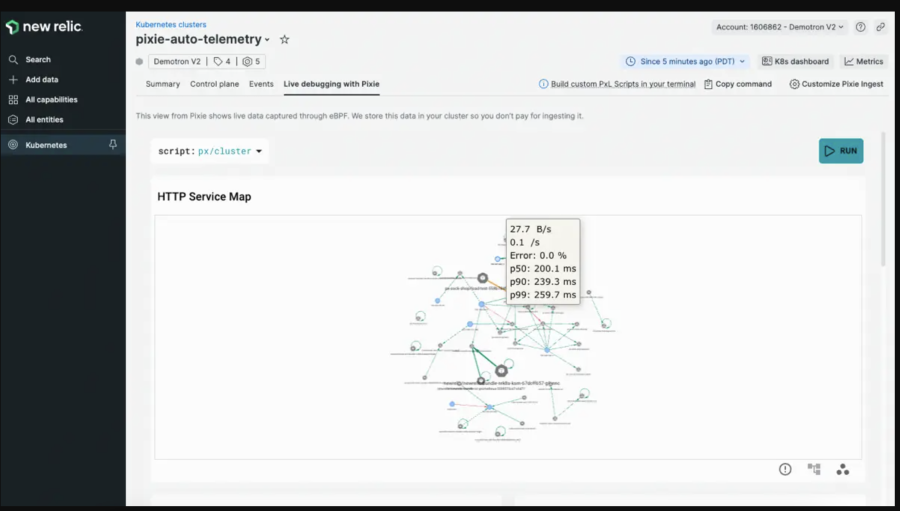
Run scripts in the live debugging with Pixie tab to debug your Kubernetes applications.
Bringing together logs, SLIs, and SLOs
When we first got logs instrumented, we saw that we could search by service, by error—you don't have that ability in CloudWatch. Log queries in New Relic are based on the Lucene query language, the logs parser in the backend helps engineers see what is going on. This is especially helpful when one engineer is responsible for a handful of microservices—and we're pushing for them to take even more ownership of their services by developing SLIs and SLOs with custom metrics. We want to go beyond latency and error rate for our services because a lot of our services aren't request based. We're a distributed system.
We’ve also integrated security scanning tools, which helps us with compliance. We're highly regulated and monitored, so everything has to be super secure. This month, for example, we got asked about an anomaly in our alerting. We could immediately see what caused it, what was missing, and what we needed to resolve the issue. From the engineering side, that's invaluable: identifying and resolving issues before they get to production.
What works really well is having these different plugins—logs, APM, distributed tracing , and infrastructure—playing with each other so that engineers get the full picture. Because of that, there’s more innovation happening now. Every transaction is instrumented, and it's powerful to see. We look at everything—metrics from browser, mobile, APM, and infrastructure. When you have access to all these rich metrics, it’s an easy story to tell what monitoring can do.
Start monitoring your Kubernetes applications with Pixie and sign up for a free account with New Relic, no credit card required.
Die in diesem Blog geäußerten Ansichten sind die des Autors und spiegeln nicht unbedingt die Ansichten von New Relic wider. Alle vom Autor angebotenen Lösungen sind umgebungsspezifisch und nicht Teil der kommerziellen Lösungen oder des Supports von New Relic. Bitte besuchen Sie uns exklusiv im Explorers Hub (discuss.newrelic.com) für Fragen und Unterstützung zu diesem Blogbeitrag. Dieser Blog kann Links zu Inhalten auf Websites Dritter enthalten. Durch die Bereitstellung solcher Links übernimmt, garantiert, genehmigt oder billigt New Relic die auf diesen Websites verfügbaren Informationen, Ansichten oder Produkte nicht.


