App Performance
New Relic Mobile provides an engine that monitors the application code for your Android and iOS apps as they service your user's interactions.
User Interaction Summary
Spot your most expensive interactions from multiple vantage points: average time taken, total time consumption, and total view count. Also provides a listing of the slowest individual traces across all interactions.
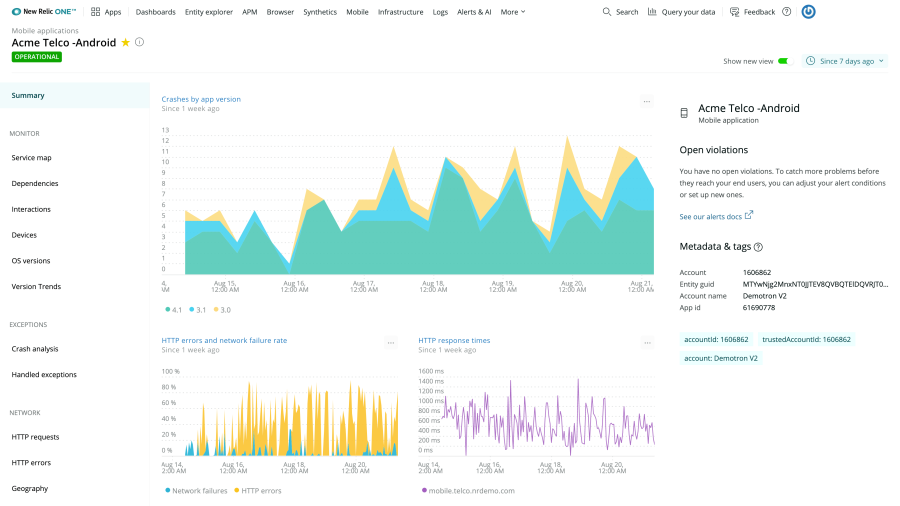
Mobile summary page
User Interaction Traces
Diagnose CPU/memory consumption, network calls, and data distribution across threads for each individual slow trace. Explore a timeline with code-level details of how each thread executes methods/classes during the trace.
OS Version Summary
Get a high-level view of how each of the operating systems your app is running on are performing. View OS performance by HTTP response time, throughput, active devices, or network failure rate.
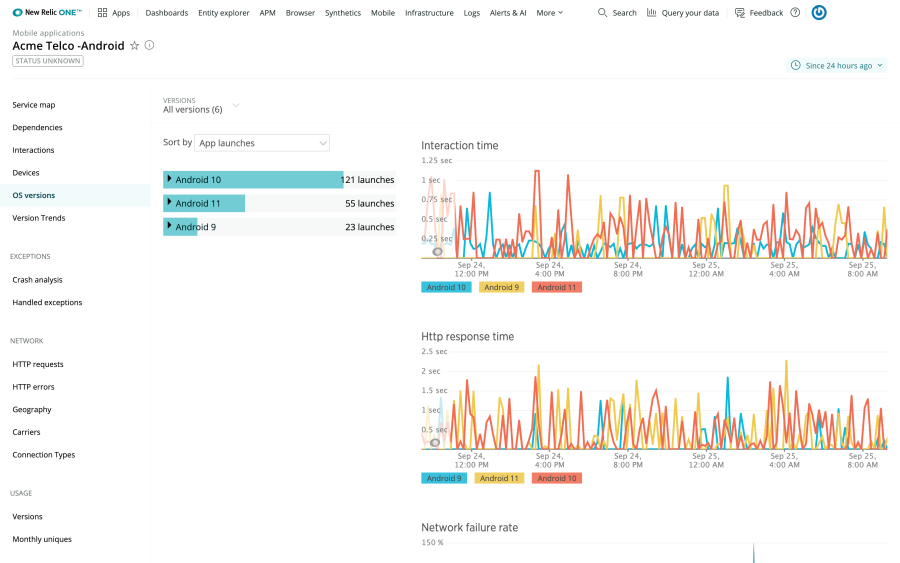
Launch performance details
OS Performance Detail
Dig into an individual operating system to understand the average interaction time, HTTP response time, network failure types, and number of active devices. Also provides a listing of the slowest traces for the OS.
User Interaction Detail
Understand how classes and methods perform in an interaction by UI & worker thread utilization, average number of calls, and average time each is taking. Also provides a listing of the slowest individual traces for a single type of interaction.
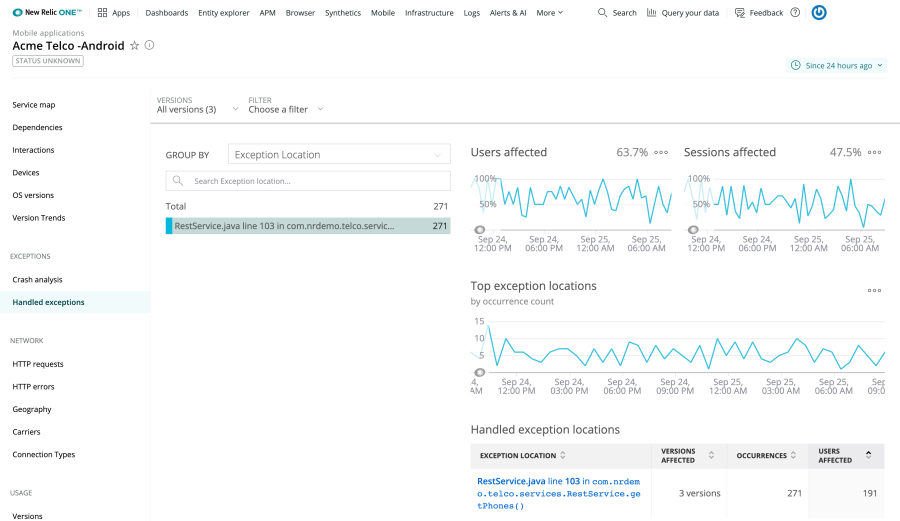
Handled exceptions
Device Performance Summary
Determine how the most commonly used devices for your app perform—sortable by interaction time, HTTP response time, throughput, device count, and network failure rate.
Device Performance Detail
Details for each individual device including a trend view of interaction time, HTTP response time, network failure types, and active sessions. Also provides a listing of the slowest traces for the device type.
Version Trends
Review usage, adoption, and performance metrics across the most recent versions of your mobile app. You can compare how each release performs by the day, week, or month after launch and take a master view of this data, too. With this information, you can respond quickly where it's needed most.
Network Performance
From the networks your apps run on around the globe to the services they are connected to, New Relic Mobile's network monitoring helps you understand what is happening to your mobile app in the complex environments where they are being used.
Connected Services Map
Get an at-a-glance view of your app's performance relationship with its connected services and the level of influence each service has on the others.
HTTP Error Reporting
Learn the types and frequency of HTTP errors occurring in your app. Dig in further to get the response body, OS, app version, time stamp, and number of unique occurrences for an individual error type.
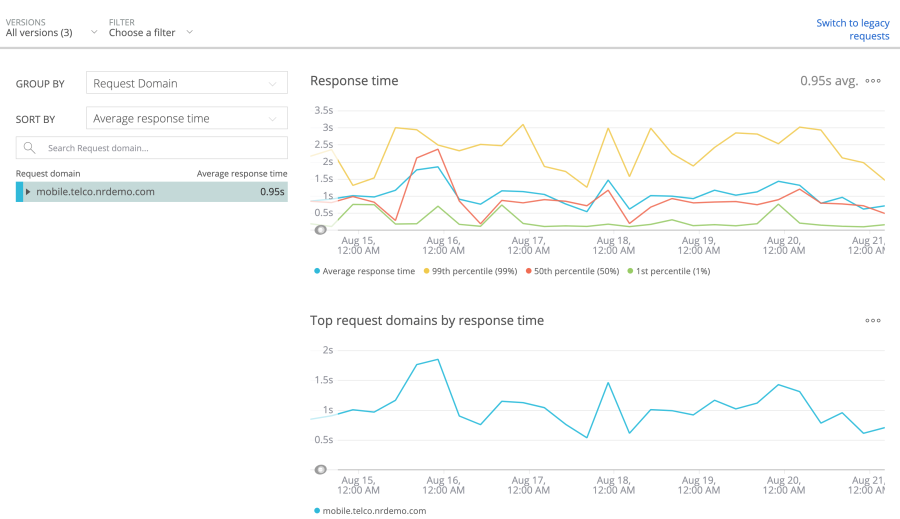
Performance and response times
Geographic Performance Reporting
The color coded world map lets you easily find the slowest response times, highest network failure rates, most number of users, and data transferred by country. Dig in to a specific country to see average response time, calls/minute, traffic volume, and the types of network failures occurring.
HTTP Requests Summary
Dissect the performance of your app's top HTTP requests by response time, requests/min, total time, or total size of the request.
HTTP Request Detail
For each specific endpoint , get detailed charts for the response time, average throughput, and average data transferred.
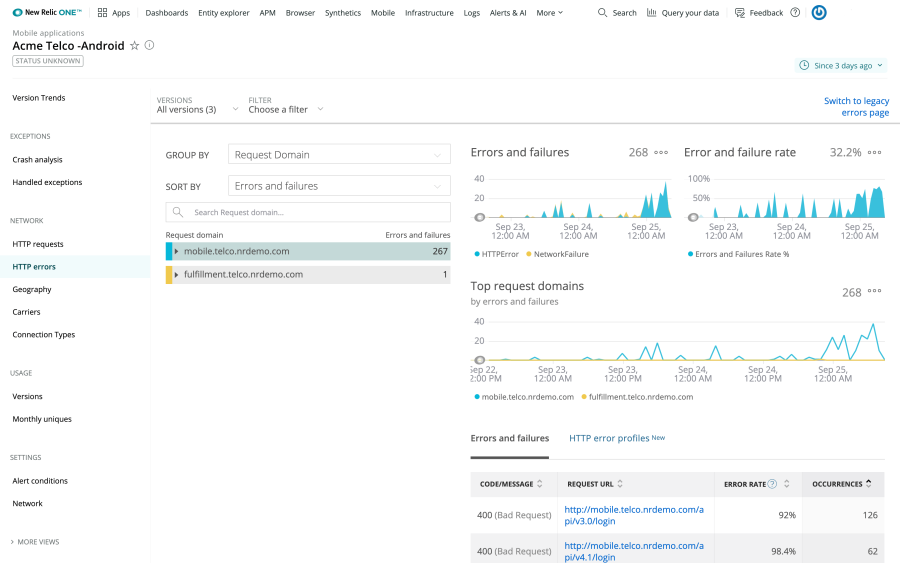
HTTP errors
Carrier Performance Reporting
These reports provide summary level views around device count, response time, and error rates for WIFI and each carrier your app is being run on. It also provides carrier specific trend reports on response time, network failures, and traffic volume.
Usage
The usage features in New Relic Mobile help you understand how many people are using each version of your app, as well as how each version of the app is performing.
Version Performance Summary
A comparative analysis of adoption and performance between multiple versions of your app, including the top ones by interaction time, active sessions, or error rate that also includes a report to compare by date created, average memory/CPU usage, average sessions per minute, and average requests/minute per active version.
Version Performance Detail
The details page provides further insight into how a specific version compares to another and the average of other versions of your app. Time series show the comparison across error rate, response time, active sessions, and memory usage.
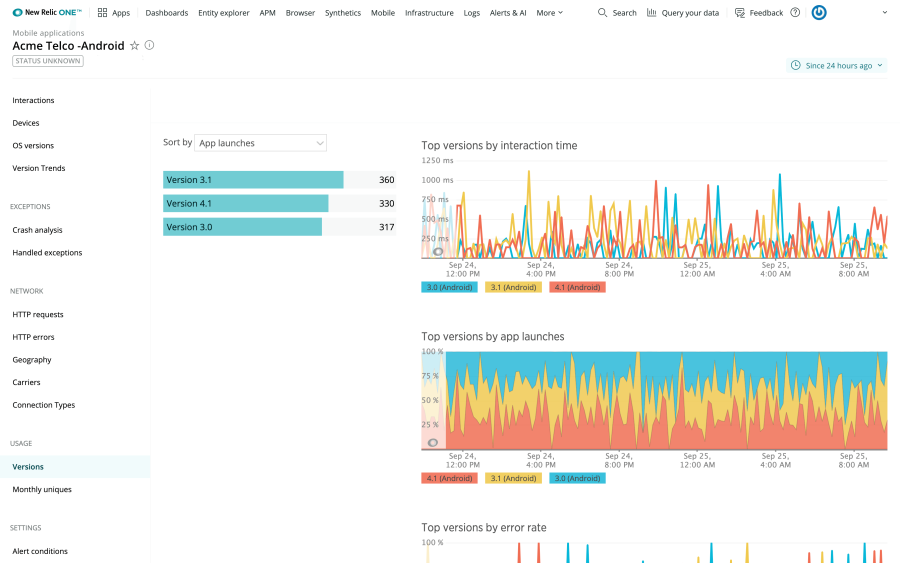
Versions
Monthly Uniques Reporting
A monthly report with a bar chart tracking the number of unique devices running your app for each month over the last year.
Network Failure Reporting
These reports show you which hosts are causing network failures and what types of failures are most commonly occurring, along with providing you a response body for each error that occurred.
Crash Reporting
Crash reporting provides insight into app crashes with detailed metrics as well as trace backs to user interactions that provide code-level visibility into crash occurrences.
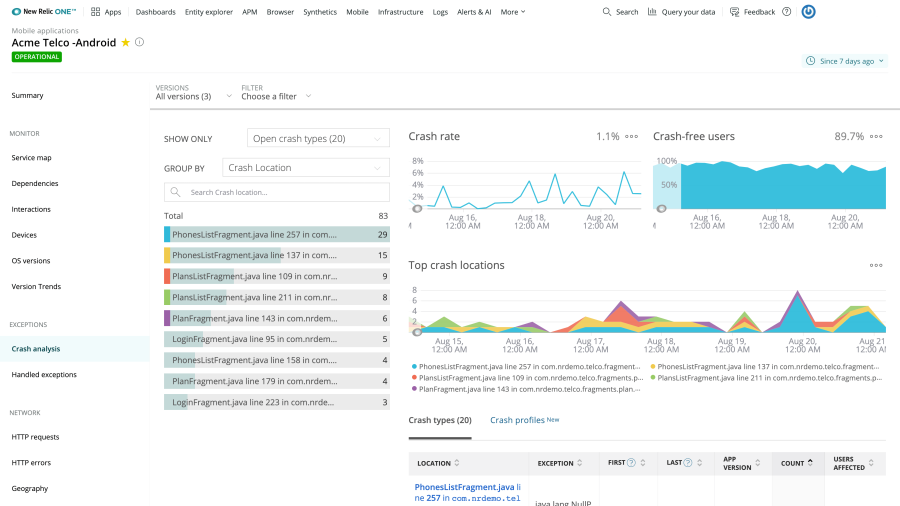
Mobile crash analytics
Crash Rate Overview & Details
Get an overview of all your app's crashes including percent of crashed sessions, weekly comparisons, number of users impacted, and details of resolved and unresolved crashes. You can also go deeper to analyze frequency trends, view symbolicated stack traces, and breakdowns by device, OS, or app version.
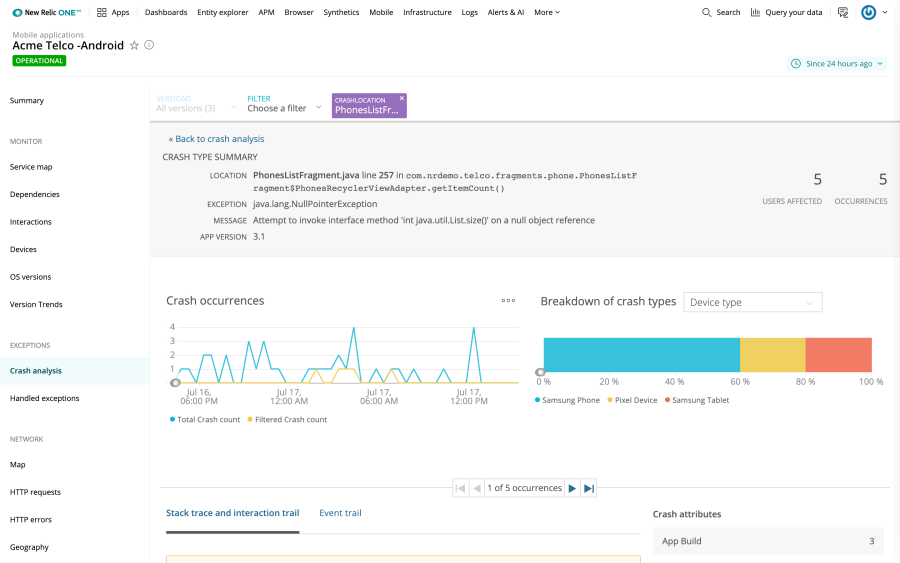
Crash details
Interaction Trail for App Crashes
With Interaction Trails, New Relic will automatically detect the trail of interactions that led up to a crash, providing code-level visibility into events that occurred prior to crash which allows for smarter troubleshooting, with minimal effort required from the developer.
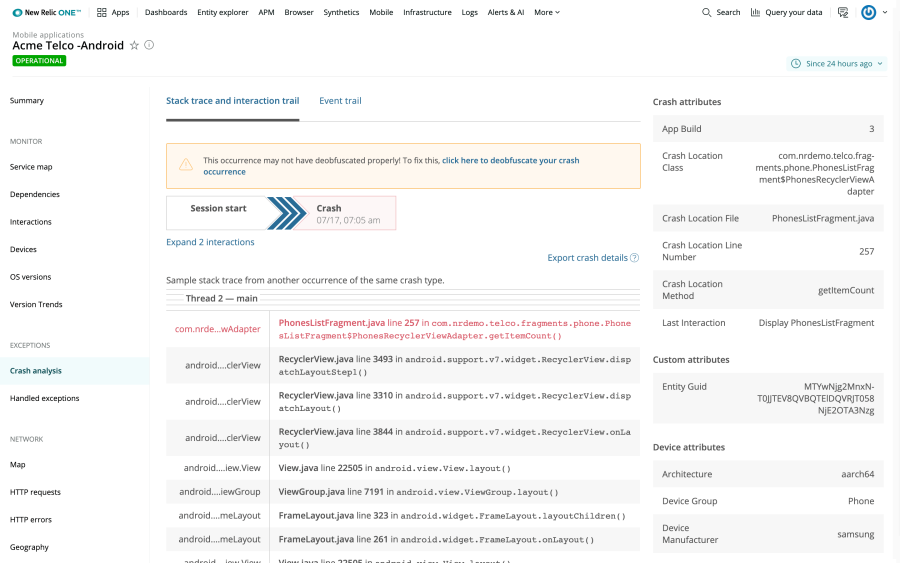
Stack traces
Crash Email Alerting
Stay alerted to any and all critical crashes that occur within your app with our email alerting capabilities, and create support tickets from right within the crash dashboard.
Alerting and Collaboration
Alerting enables you to set your own warning and critical thresholds so you can stay on top of finding and resolving problems quickly, and collaboration allows you to easily share problems/solutions with your team members.
Alerts for critical performance issues
Receive alerts based on the health of network services your mobile apps talk to by: HTTP status error rate, network failure rate, or response time. Admins can customize Caution and Critical alert conditions for each external host.
Receive alerts on app execution time with our new Alerts features.
Custom dashboards
Keep an eye on your most critical performance metrics by adding them to a custom dashboard.
Quickly view app health
New Relic Mobile uses color-coded status indicators throughout to help you quickly spot performance issues.
Collaborate with your team
Collaborate with your team members in context of a report by adding notes/comments and replying inline.
Integrate with your ticketing system
File tickets related to performance problems directly into your ticketing system. Learn which ticketing systems we support here.
Security
New Relic is committed to helping customers make their applications fast and secure. We take protecting our customers' data seriously, here's an overview of how we do it.
US and EU Data Regions
Our global data-hosting structure consists of two regions: European Union and United States. You can select your preferred data region during the account setup process, regardless of your physical location. (Note: We do not support migration or aggregation of data across regions.)
Secure Data Center
The infrastructure that runs the New Relic service and stores our customer's data resides in a Tier III, SSAE-16 certified data center. Customer data is backed up on a regular basis.
Secure by Default
We strongly believe in the concept of "secure by default.” Customers have to explicitly enable settings within New Relic to authorize the sending of sensitive data.
Configurable Security
Your applications may handle sensitive data and we take your concerns about what data is sent to New Relic seriously. As such, we provide our customers with complete control over what, if any, sensitive data is sent our way.
SOC 2 Audited
New Relic has successfully completed a SOC 2 audit of processes and controls relevant to security and availability. This audit reviews our security process and controls and provides both ourselves, and more importantly our customers an independent, third-party assurance that we are taking the appropriate steps to protect our systems and our customer's data.
Continuous Monitoring
New Relic employs both internal and third-party services to perform continuous security scanning on both our network and applications to ensure that our applications and servers remain secure.
Compliance Friendly
New Relic can be configured to operate securely in regulated environments such as PCI, HIPAA, or SOX. In addition we are Swiss and EU Privacy Shield certified.
Enterprise Mode
For customers with very high security needs, we have recently added an Enterprise Security Mode that lets you lock down the available security options so that your own employees can't accidentally enable the transmission of sensitive data.