Quickstart
About Vercel
Vercel is the platform for frontend developers, providing the speed and reliability innovators need to create at the moment of inspiration.
We enable teams to iterate quickly and develop, preview, and ship delightful user experiences. Vercel has zero-configuration support for 35+ frontend frameworks and integrates with your headless content, commerce, or database of choice.
About this integration
This integration is the fastest way to jump straight into monitoring your end-to-end development logs. You also have the ability to monitor your APM traces through Open Telemetry.
Vercel dashboard & visualization
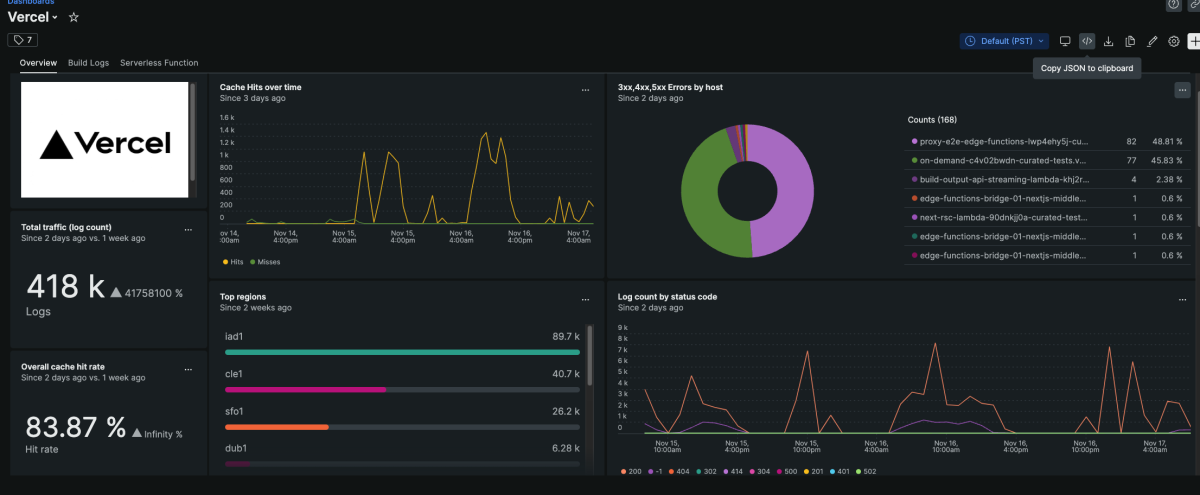
The Overview dashboard will populate with logs from your Vercel projects after you complete integration set up. This customized board provides key log data to provide you with a high-level overview of the performance of your functions.
Core monitoring
- Track your cached hit rate
- Keep track of your errors and problematic IP addresses
- Real time error logs
- Monitoring for your build logs
Serverless function log monitoring
- Average & total duration
- Average & total memory used
- Average & total billed duration
OTeL APM traces
You can view your Vercel traces by navigating in the New Relic UI to APM & Services > [Appname] > Distributed tracing . From this view you can drill down into individual traces, or view any errors that have occurred, and better understand how your application is performing.
Need help? Visit our Support Center or check out our community forum, the Explorers Hub.

