Derzeit ist diese Seite nur auf Englisch verfügbar.
 / 
Temporal Cloud

Temporal Cloud

Monitor and analyze your Temporal Cloud with New Relic

What's included?

dashboards
1
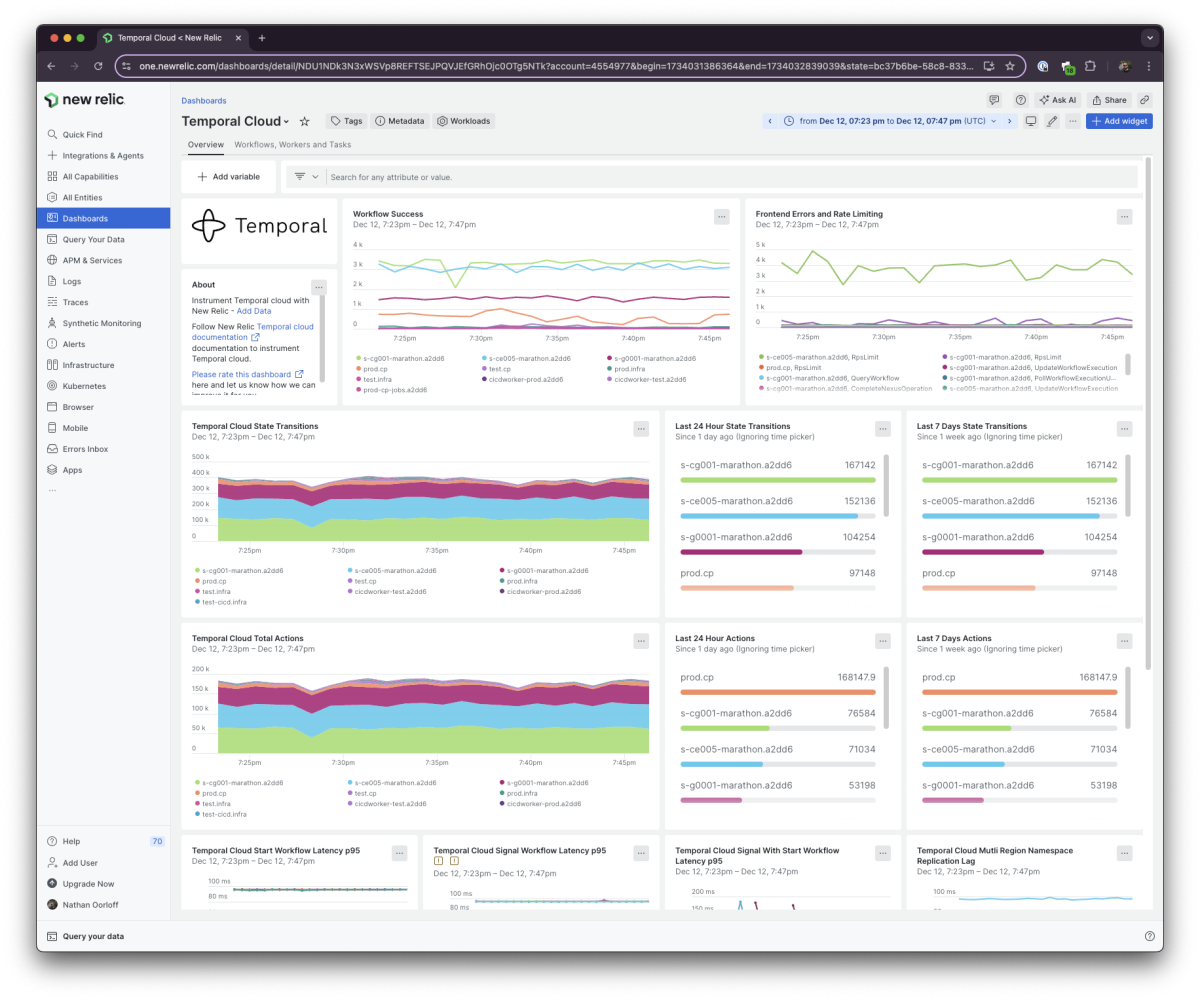
Temporal Cloud quickstart contains 1 dashboard. These interactive visualizations let you easily explore your data, understand context, and resolve problems faster.
alerts
3
Temporal Cloud observability quickstart contains 3 alerts. These alerts detect changes in key performance metrics. Integrate these alerts with your favorite tools (like Slack, PagerDuty, etc.) and New Relic will let you know when something needs your attention.
Service Latency
This alert is triggered if the Temporal cloud service latency exceeds 5 seconds for 5 minutes.
Failed Workflows
This alert is triggered if the Temporal cloud workflows fail once within a 5-minute window.
RPS Limit
This alert is triggered if the Temporal Cloud RPS limit is reached.
documentation
1
Temporal Cloud observability quickstart contains 1 documentation reference. This is how you'll get your data into New Relic.

Why monitor Temporal Cloud?

Monitoring allows you to identify performance bottlenecks, such as slow workflows or inefficient resource usage, optimize your Temporal Cloud for better performance, and help you detect and diagnose faults or errors in your Temporal workflows.

Comprehensive monitoring quickstart for Temporal Cloud

Temporal Cloud metrics help you monitor performance and troubleshoot errors. Integrating Temporal Cloud with New Relic enhances system health maintenance, early issue identification, and smooth operation assurance. This integration leverages the strengths of both systems to offer a comprehensive monitoring solution, encompassing metrics and alerts. Customize the following steps based on the specific programming language and framework of your Temporal Cloud services.

What’s included in this quickstart?

New Relic Temporal Cloud monitoring quickstart ability to cover quality on out-of-the-box reporting.

  • Dashboards (failed, canceled, and terminated workflows, service latency and frontend service requests)
  • Alerts (failed workflows and service latency)

How to use this quickstart

  • Sign Up for a free New Relic account or Log In to your existing account.
  • Click the install button.
  • Install the quickstart to get started or improve how you monitor your environment. They're filled with pre-built resources like dashboards, instrumentation, and alerts.
Authors
New Relic
Praveen Kudikyala
Support
BUILT BY NEW RELIC
Need help? Visit our Support Center or check out our community forum, the Explorers Hub.