Derzeit ist diese Seite nur auf Englisch verfügbar.
 / 
Azure Data Explorer

Azure Data Explorer

Monitoring Azure Data Explorer toolbox gives you an end-to-end solution for data ingestion, query, visualization and management. Install the New Relic Azure Data Explorer monitoring quickstart to get a pre-built dashboard tailored to monitor your Azure Data Explorer service.

What's included?

dashboards
1
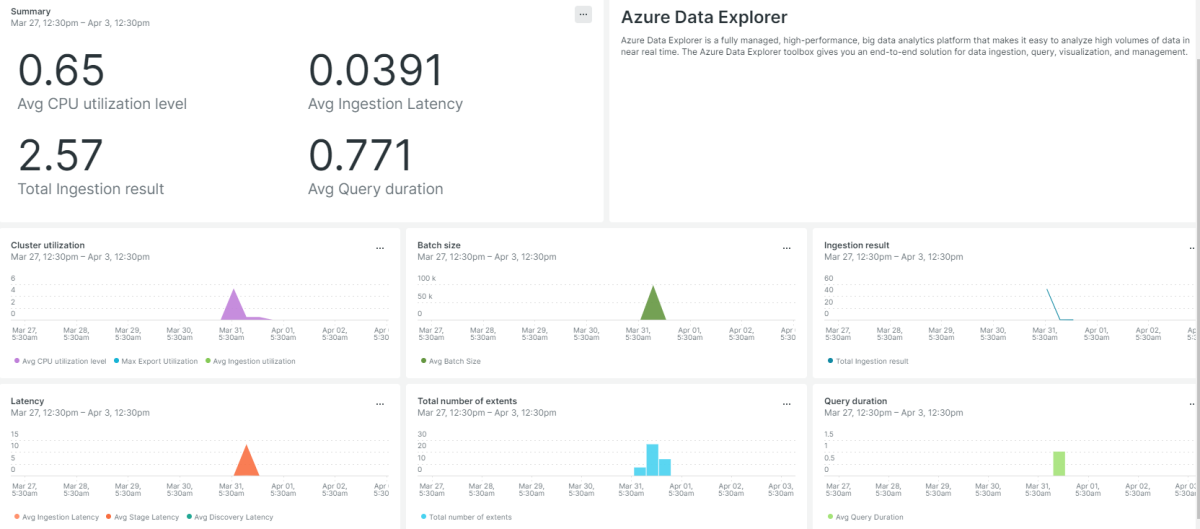
Azure Data Explorer quickstart contains 1 dashboard. These interactive visualizations let you easily explore your data, understand context, and resolve problems faster.
documentation
1
Azure Data Explorer observability quickstart contains 1 documentation reference. This is how you'll get your data into New Relic.
alerts
0
This quickstart doesn't include any alerts. Do you think it should?
You can edit this quickstart to add helpful components. View the repository and open a pull request.
View repo View repo

What is Azure Data Explorer?

Azure Data Explorer is a fast, fully managed data analytics service for real-time analysis on large volumes of data streaming from applications, websites, IoT devices and more.

New Relic Azure Data Explorer quickstart features

A standard dashboard that tracks key indicators like CPU utilization level, ingestion latency, ingestion result and query duration. It runs custom queries and visualizes the data immediately.

Why monitor Azure Data Explorer with New Relic?

New Relic Azure Data Explorer monitoring quickstart empowers you to track the performance of Azure Data Explorer via different metrics including CPU utilization level, ingestion latency, ingestion result and query duration.

Our integration features a standard dashboard that provides interactive visualizations to explore your data, understand context, and get valuable insights.

Start ingesting your Azure data today and get immediate access to our visualization dashboards so you can optimize your Azure service.

How to use this quickstart

  • Sign Up for a free New Relic account or Log In to your existing account.
  • Click the install button.
  • Install the quickstart to get started or improve how you monitor your environment. They're filled with pre-built resources like dashboards, instrumentation, and alerts.