Quickstart
Comprehensive monitoring quickstart for Apache Traffic Server
By integrating Apache Traffic Server (ATS) with New Relic, you can efficiently set up a monitoring infrastructure that captures, visualizes, and alerts you to important ATS metrics. Monitoring ATS performance and health ensures smooth operation, rapid issue identification, and proactive problem resolution, ultimately enhancing the reliability and efficiency of your web infrastructure.
Why is it important to monitor Apache Traffic Server?
Monitor Apache Traffic Server to understand the functionality, performance, and general health of this potent web caching and proxying solution. You will obtain a thorough insight of ATS's behavior, spot any problems before they become serious, and make sure that your web infrastructure is working as efficiently as possible by closely monitoring it.
By leveraging New Relic, you can gain a more in-depth understanding of Monitoring Apache Traffic Server is an essential procedure that provides priceless information about the functionality, performance, and general health of this potent web caching and proxying solution. You will get a comprehensive understanding of ATS behavior, spot any problems before they become serious, and make sure that your web infrastructure is working as efficiently as possible by closely monitoring it.
Install this quickstart as part of your proactive observability strategy to guarantee outstanding web performance, exceptional user experiences, and dependable functioning of your web infrastructure. You can efficiently manage ATS and keep up a solid, high-performance web infrastructure.
What’s included in this quickstart?
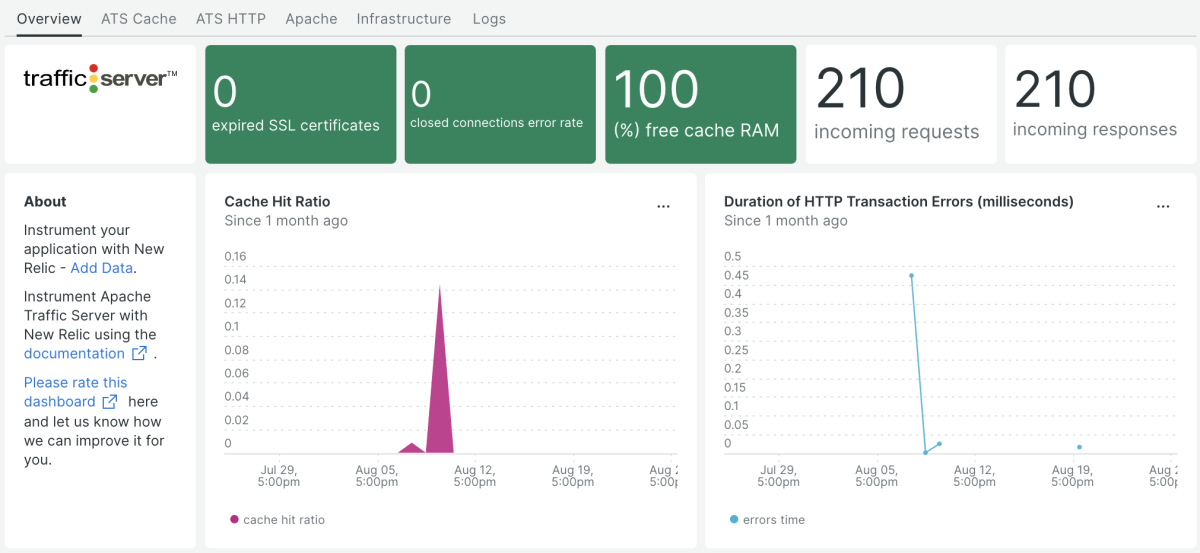
The Apache Traffic Server quickstart provides out-of-the-box reporting that covers the following areas:
- Real-time visibility: Get insights into the performance of your ATS deployment in real time.
- Optimized performance: Identify performance bottlenecks and optimize your ATS configuration to improve performance.
- Early issue detection: Get alerts when there are potential problems with your ATS deployment so you can take action quickly.
- Capacity planning: Plan for future growth by understanding how your ATS deployment is currently being used.
- Efficient troubleshooting: Troubleshoot problems with your ATS deployment quickly and easily by using New Relic's tools.
- User experience enhancement: Improve the user experience of your applications by understanding how they are being used and making changes to improve performance.
- Security insights: Get insights into the security of your ATS deployment and identify potential threats.
- Continuous improvement: Use New Relic's data to continuously improve the performance and security of your ATS deployment.
Monitoring Apache Traffic Server (ATS) with New Relic can help you improve the performance of your online services, which can lead to increased user engagement, longer site visits, and higher revenue.
Need help? Visit our Support Center or check out our community forum, the Explorers Hub.


