Trace HTTP Requests in Real Time.
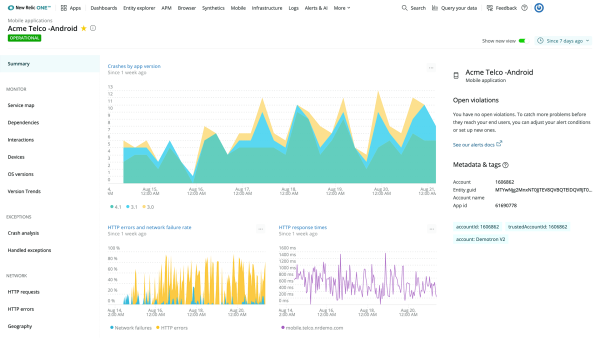
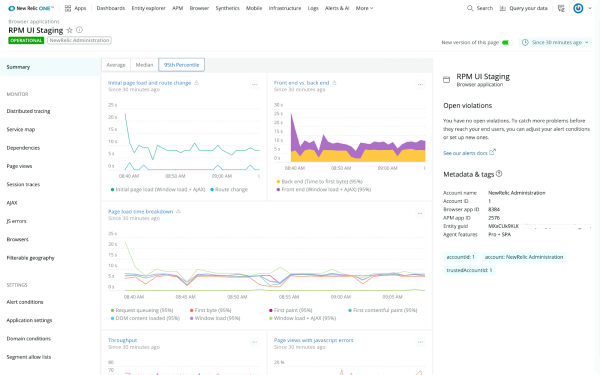
- For each HTTP request, trace the number of entities it connects to and how they interact with one another, live.
- See HTTP response trends for all your React Native-instrumented applications.
- Drill down into in-process spans to quickly determine which services are impacting your application.


Understand user behavior better with Event Trail.
- See exactly what users were doing in each webpage down to the millisecond that an error happened.
- Dive into a stack trace of requests called, and know which services triggered the error.
- View critical metrics like device type, OS, and geographic region for each user experiencing an issue.
Analyze crashes intelligently for your React Native applications.
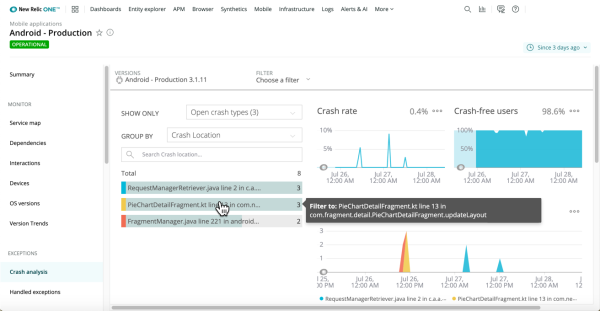
- Track not only native iOS and Android crashes, but also crashes due to React, all in one view.
- Get insights into anomalous crashes using ML-powered analysis, and add relevant trends to a customizable dashboard.
- Set alerts to notify your engineers when crash or error rates exceed a certain threshold.


