New Relic continues to offer the most comprehensive and, according to Gartner Peer Insights, the highest-rated APM solution available.
Today, we’re building on this leadership by empowering you with unparalleled visibility into your distributed systems, while eliminating the operations burden of complex on-premises tracing software.
That’s why we’re so excited to introduce New Relic Edge with Infinite Tracing—a service that eclipses existing distributed tracing solutions by observing 100% of application traces and providing you visualizations and storage for the most actionable data. And it’s all delivered as a fully managed, cloud-native service with unlimited, on-demand scalability.
More flexibility and less complexity
Developers building modern microservices-based apps are responsible for highly interconnected distributed systems. The service complexity is high, typically involving different technologies, frameworks, infrastructure, and deployment mechanisms. In addition, most enterprise environments have a mix of legacy monolith apps running alongside newer microservices-based apps.
All this complexity can create major headaches when you have to track down and resolve issues. The tools you use for troubleshooting need to be just as comprehensive and agile as your application stack without adding unnecessary complexity and toil.
Observe everything without the hassle
In high-volume microservices-based distributed systems, all tracing telemetry should be observed and analyzed, and the most actionable data should be stored and visualized for quick troubleshooting before issues impact customers. But you shouldn’t have to take on additional operational toil to capture every trace. Companies that win are laser-focused on executing on their business. That’s why you need an on-demand, fully managed service that manages the complexity of distributed tracing ingest for you and scales as your business grows, freeing engineers for more high-value efforts. You didn’t move to the cloud and get rid of all the on-prem toil only to repeat previous mistakes and set up monitoring components when there is a better alternative.
Data egress without breaking the bank
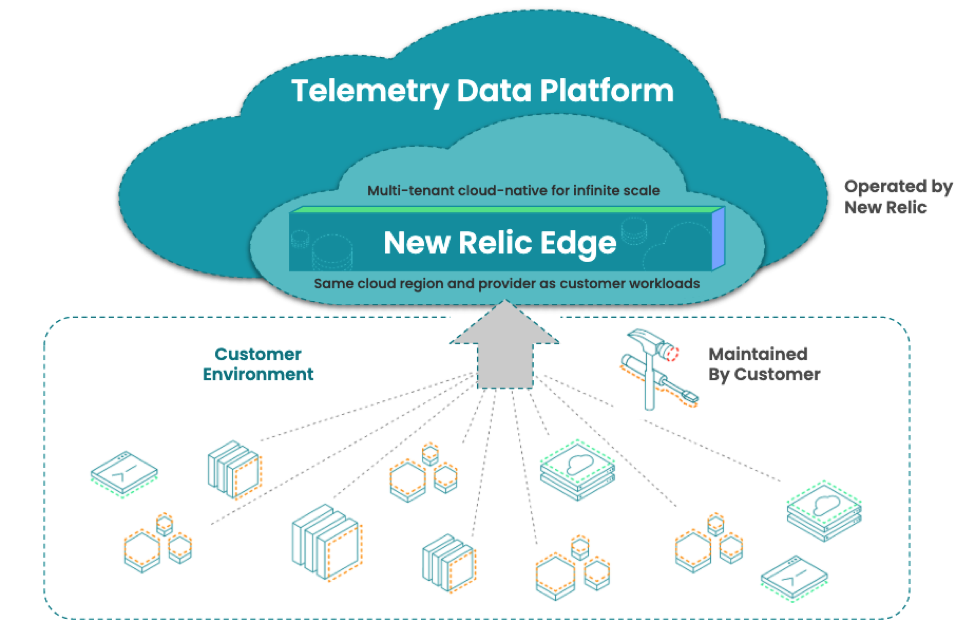
In many environments, the amount of trace telemetry that’s emitted across a distributed system easily crosses into the tens of millions or even hundreds of millions of spans per minute. The data egress charges (not to mention the data storage charges) can add up quickly. For this reason, it’s critical to minimize data egress charges by using a service that’s located in the same cloud region and with the same provider as your workloads.
How existing approaches fall short
Point-solution providers and other vendors that have stitched together patchwork monitoring products have created complex, hard-to-use tooling. Many software teams that evaluate these tools when seeking to better understand the health and performance of their distributed systems often end up frustrated by the complexity, underwhelmed by the lack of capabilities, and shocked by the astonishingly high costs. These tools fall significantly short in several key areas:
Unnecessary burden on software teams
Patchwork and point-solution tools require you to deploy, manage, and scale complex on-premises tracing infrastructure and software. These tools create an unnecessary operational burden because you have to staff and plan to operate gateways, proxies, and satellites. This is an incredibly difficult task when considering all the factors involved in planning for usage spikes, resiliency, cost, and scale.
Unacceptable costs for data egress and storage
Patchwork and point-solution tools require you to transmit and store vast amounts of tracing telemetry over the internet. This quickly becomes an incredibly expensive data egress problem. Making matters worse, the overwhelming majority of transaction requests across a distributed system will complete without any issues, which means most trace data is statistically uninteresting and generally unhelpful for quickly finding and resolving problems. The question you have to ask yourself is “why would I pay for the haystack, when all I care about is the needle?”
Underwhelming capabilities and increasing mean time to resolution (MTTR)
Patchwork and point-solution tools weren’t designed with capabilities for capturing and combining mobile, real user monitoring (RUM), synthetics, and other fundamental telemetry data with trace telemetry and business context for comprehensive observability. That means you spend more time jumping between tools when troubleshooting issues, resulting in dramatically increased MTTR.
The next evolution of distributed tracing
New Relic Edge with Infinite Tracing is a new fully managed, cloud-native service that fundamentally changes the way software and DevOps teams use and instrument for distributed tracing. The service completely removes the operational burden of managing complex tracing software, so engineers are free to instrument their microservices to generate unlimited trace telemetry without worrying about the complexities associated with deploying and scaling on-premises components.
This new service observes all application traces across your distributed systems and provides visualization and storage for the most actionable data so you can investigate and solve issues faster. There’s no infrastructure to manage. You don’t need to staff or plan for operating the service, and it provides unparalleled, on-demand scalability.
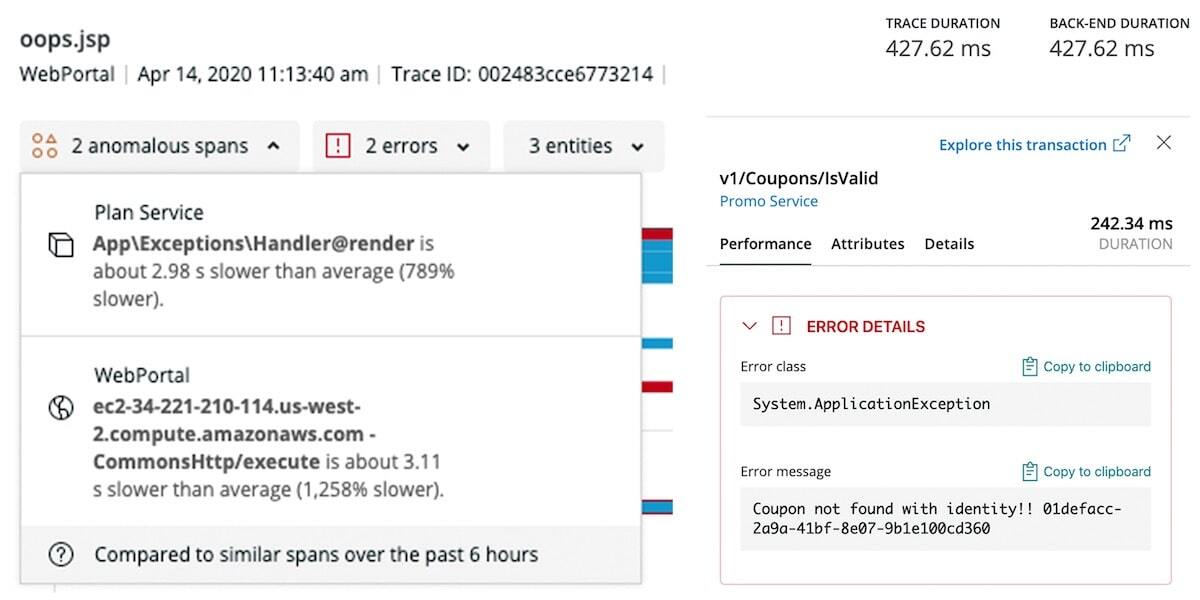
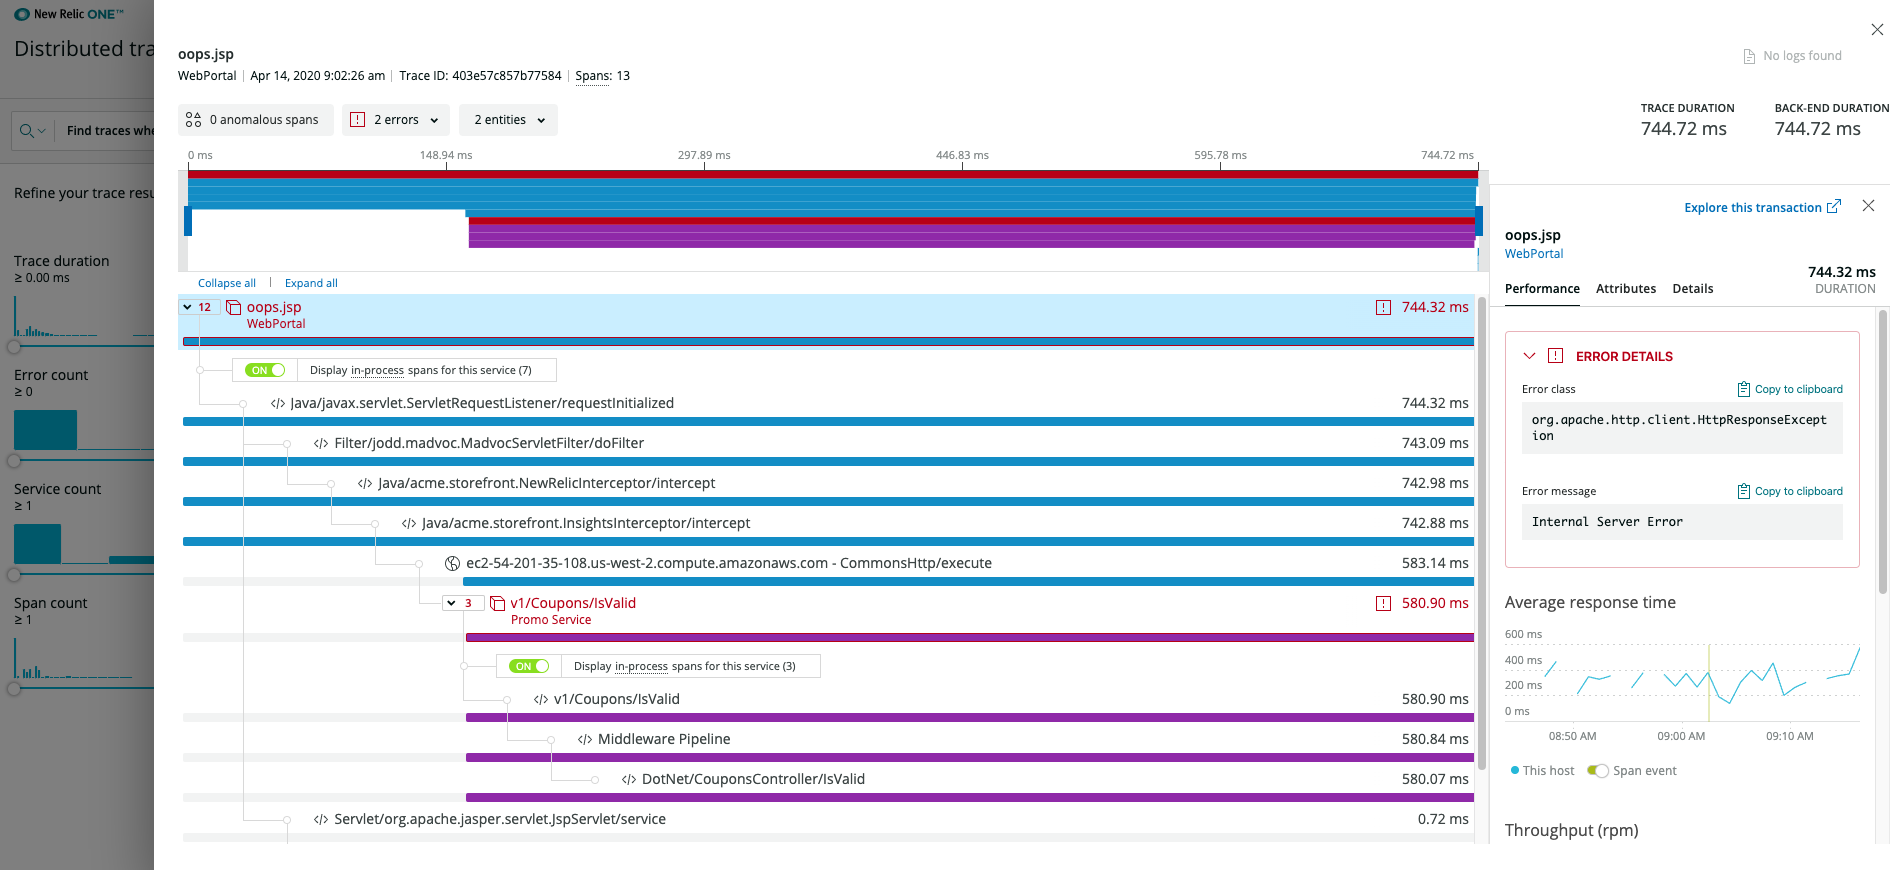
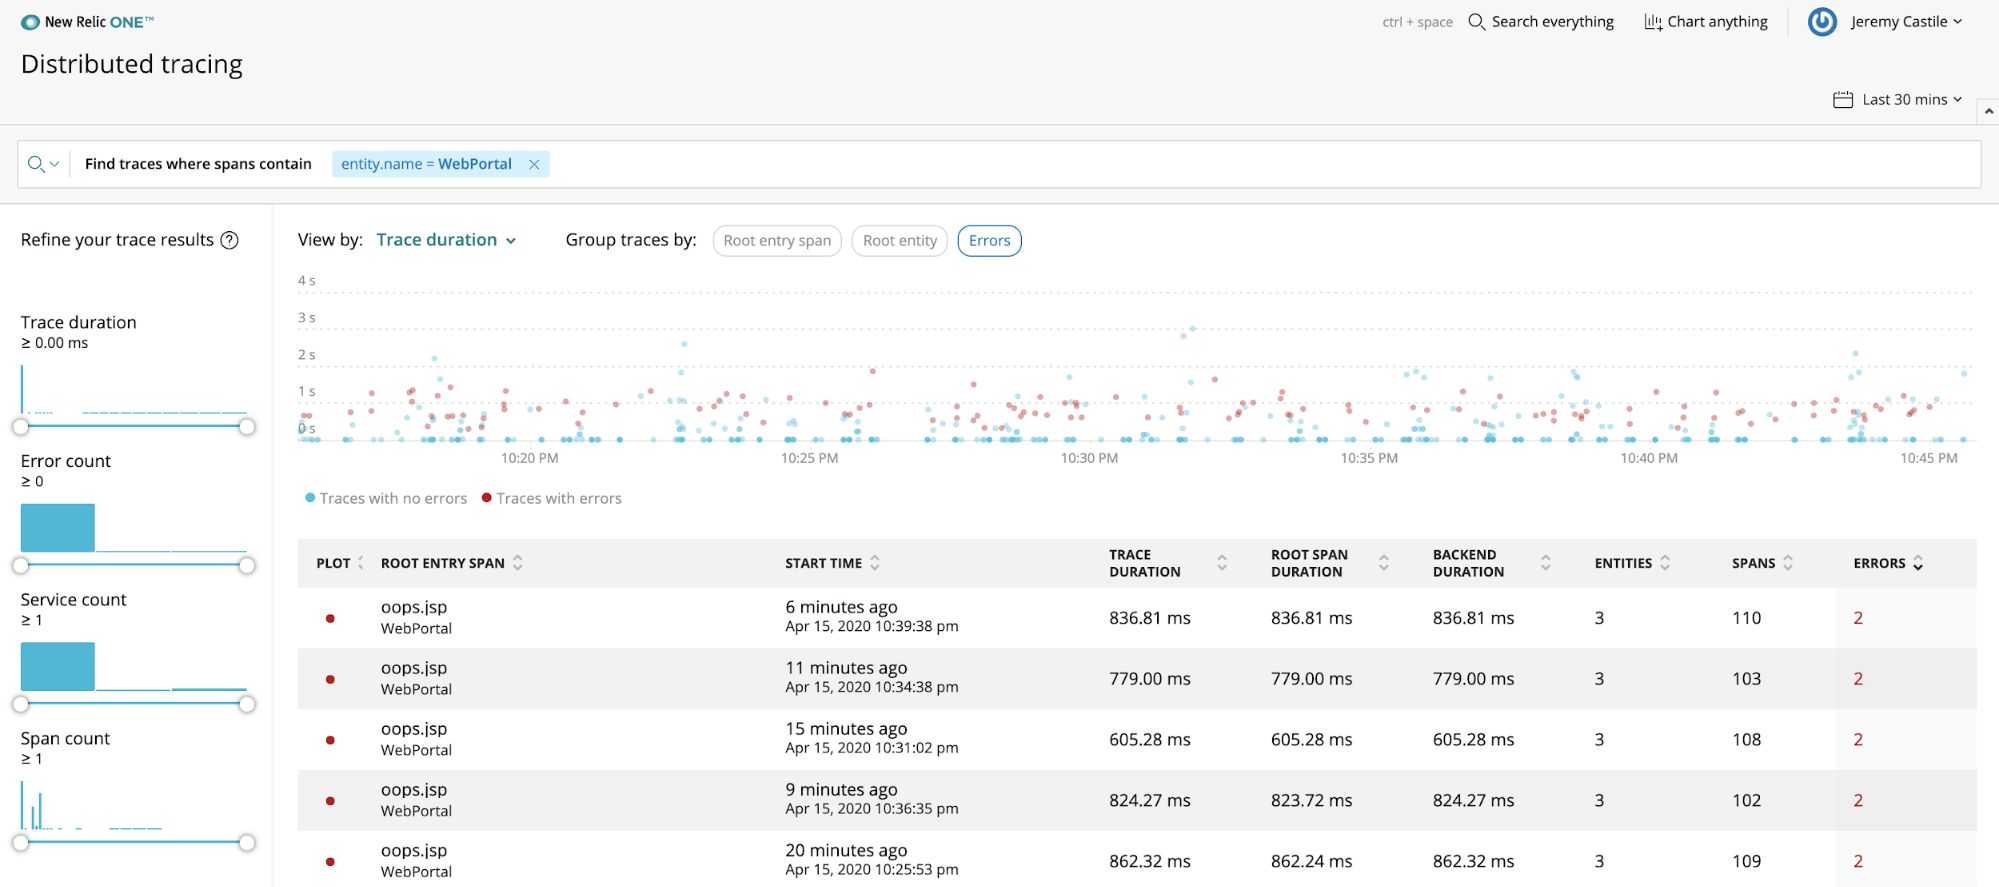
Find and fix issues fast
Troubleshooting distributed systems is a classic needle in the haystack problem. New Relic Edge with Infinite Tracing automatically eliminates the noise, based on what’s most important, like focusing on errors, or high latency traces so you can quickly find issues and fix them fast.
Fully managed service eliminates operational burden
New Relic Edge with Infinite Tracing gives you everything you want, without the hassle of managing and scaling complex on-premises gateways or satellites. With this new service, you never have to worry about spinning up additional tracing infrastructure.
Cloud local means lower costs
New Relic Edge with Infinite Tracing is the only fully-managed, cloud-native data collection service that’s located in the same region and with the same provider as your cloud-based workloads, allowing for low-latency and low-cost data transfer. That means you can send more tracing telemetry while saving on data egress charges.
Full support for open, vendor-neutral instrumentation
New Relic gives you the flexibility to send trace telemetry from any source, including open instrumentation, serverless functions, or proprietary agents. You can choose the right instrumentation tool for the job, whether it's open source or a New Relic agent. Since our platform is vendor-neutral, it provides interoperability for all these sources without penalty. We’re committed to providing you with a vendor-neutral platform and user experiences with support for popular open source tracing tools and standards like OpenTelemetry, OpenCenus Go and Python), as well as service mesh tools like Istio.
Heads or tails, you choose
New Relic is the only solution provider that puts the power back in the hands of software teams and lets them choose the best distributed tracing option for their applications. We understand that many teams manage a mix of legacy monolith apps right alongside microservices-based apps with different monitoring requirements for each. With New Relic, software teams have the flexibility to choose standard distributed tracing with head-based sampling or Infinite Tracing with tail-based sampling.
Leverage the power of the platform
New Relic One gives you the ability to connect your tracing telemetry with full-estate observability data, including RUM, Infrastructure, Logs, Programmability, dashboarding, and more. And it’s all built on the world’s most powerful telemetry database so you get complete end-to-end visibility with unparalleled flexibility and lightning-fast search and visualization capabilities.
New Relic Edge with Infinite Tracing: How you benefit
|
Capabilities |
Customer Value |
|
|---|---|---|
| New Relic Edge |
|
|
| Infinite Tracing |
|
|
| Cloud Local |
|
|
| Open Source Instrumentation & Service Mesh |
|
|
| Flexible Distributed Tracing |
|
|
| Anomaly Detection |
|
|
| Deployment Markers |
|
|
| Global Trace Search |
|
|
| New Relic One |
|
|
Getting Started with New Relic Edge
Leverage our fully managed service and start observing 100% of your tracing telemetry today. Visit our website to sign up and see our documentation for more information.

Les opinions exprimées sur ce blog sont celles de l'auteur et ne reflètent pas nécessairement celles de New Relic. Toutes les solutions proposées par l'auteur sont spécifiques à l'environnement et ne font pas partie des solutions commerciales ou du support proposés par New Relic. Veuillez nous rejoindre exclusivement sur l'Explorers Hub (discuss.newrelic.com) pour toute question et assistance concernant cet article de blog. Ce blog peut contenir des liens vers du contenu de sites tiers. En fournissant de tels liens, New Relic n'adopte, ne garantit, n'approuve ou n'approuve pas les informations, vues ou produits disponibles sur ces sites.


