Uptime and Availability
Easily create monitors
Easily add or edit monitors, use the Synthetics REST API, or create monitors from specific locations or private servers. Get notified when New Relic has stopped receiving data from your hosts with our host not reporting feature in infrastructure monitoring.
Test from anywhere
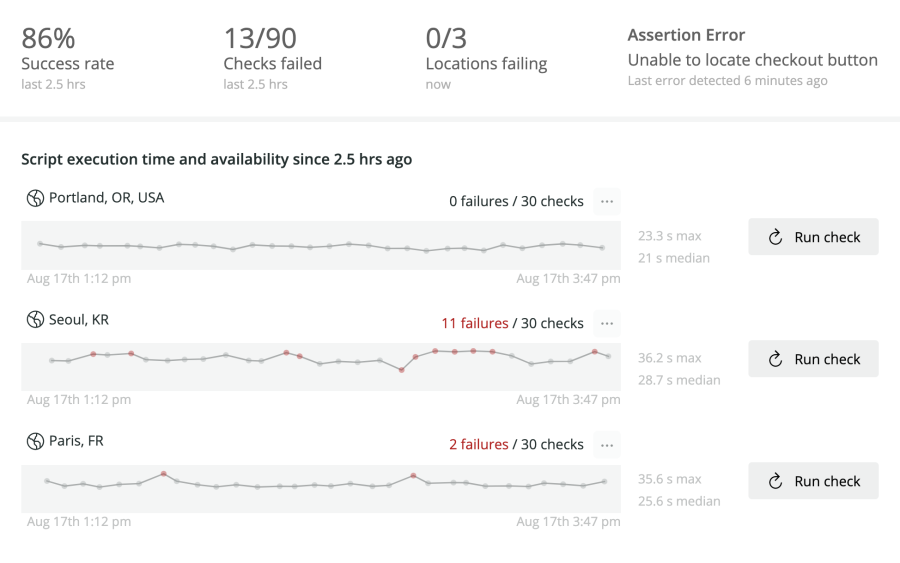
Monitor your endpoints from several global locations. Use private locations to monitor employee-facing applications or endpoints existing behind the firewall.
Automatically track SLAs
Use SLA reports to view summary performance metrics across time or multiple monitors. Compare your current performance to historical metrics with daily, weekly, and monthly reporting.
Troubleshooting issues
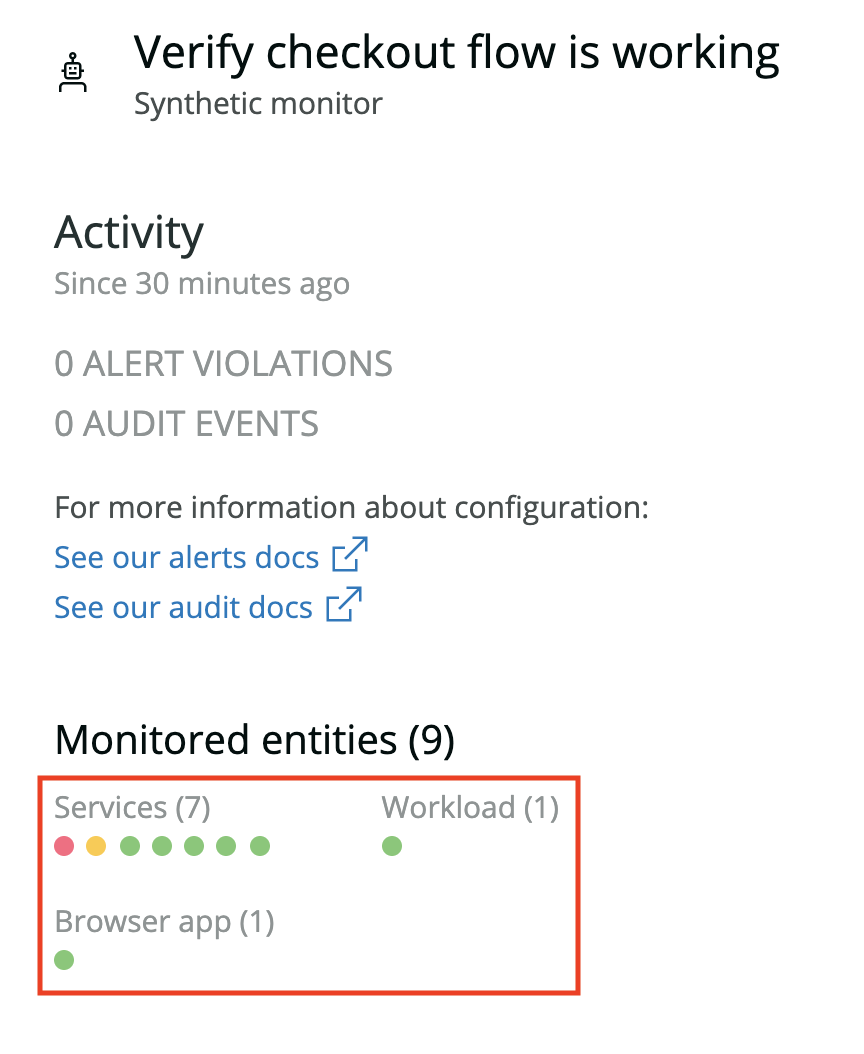
View endpoint vs. service health
Compare endpoint failures against the health of their underlying services to diagnose if issues are caused by network performance or backend services.

Rapid context for failures and downtime
Use the Failures page to troubleshoot downtime, failures, or outages. Synthetics gives you context to understand the severity, scope, and geographic impact of outages as your first step in troubleshooting.

Full stack context
While troubleshooting, use New Relic’s full stack connectivity to examine the health of services, workloads, website performance, API and third party performance, and more.
Error screenshots
See the same issues your users are experiencing with your software through actual screenshots of the errors that are occurring.
Improving Customer Experience
Waterfall charts
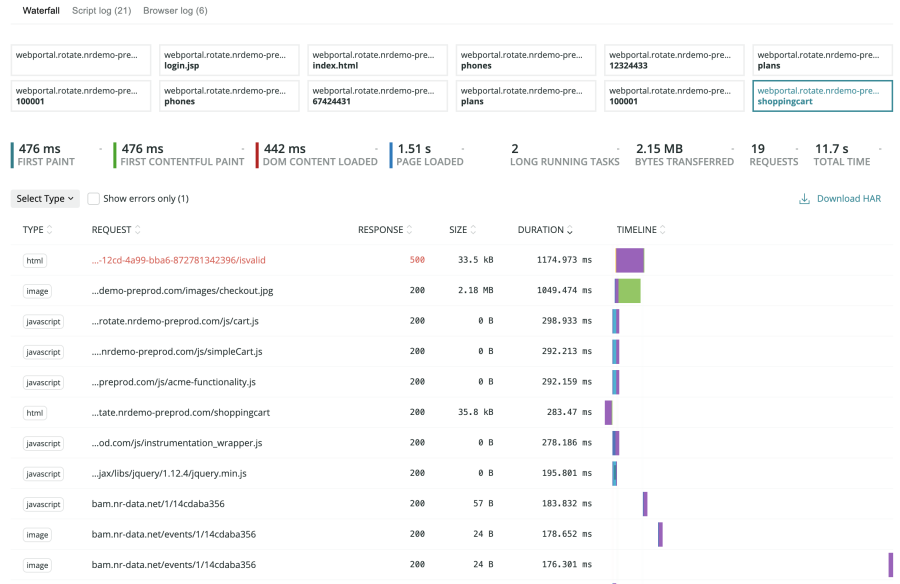
Understand how your page resources, third parties, and APIs result in page performance and the end-user experience.

User-centric perceived performance
Paint metrics like First Paint and First Contentful Paint help you understand how fast your pages display visual content. Long Tasks help you measure and improve page interactivity.
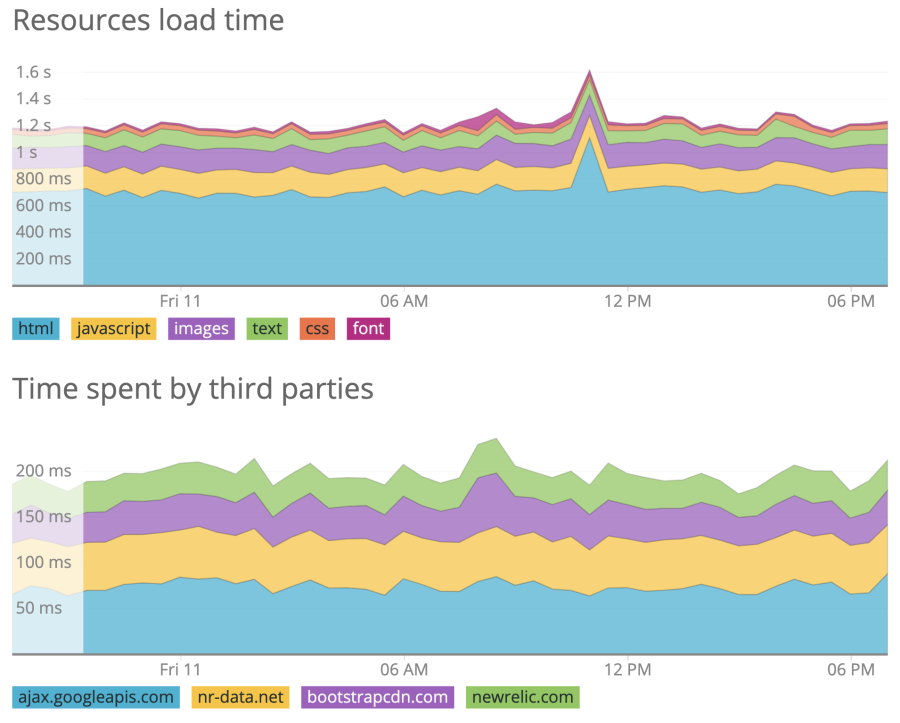
Third party and API performance
Understand which third party resources and APIs negatively impact your customer experience.

Measure user pathway performance
Use our IDE script editor or several available script recorders to recreate, simulate, and measure your dynamic page experience. From authentication and login, to simulating user behavior and into checkout, simulate all user behavior to improve functionality and find performance problems.
Essential Features
Pause monitors for scheduled site maintenance
Easily pause monitors during routine maintenance, scheduled service interruptions, or planned outages with Monitor Downtime.
Manage passwords and sensitive user data
Secure, store, update, and manage your passwords and all sensitive user data with Secure Credentials. Updating multiple passwords across several monitors is automatic and easy.
Response codes
Synthetic monitors return additional response codes beyond standard HTTP response codes, visible in the Resources page. These response codes are based on Chromium's response codes and give you more detail on your monitor behavior.
Compare Synthetic vs. RUM data
Easily view synthetic monitor results vs. your real user traffic with our comparative charting feature.