Moving to Kubernetes-as-a-Service
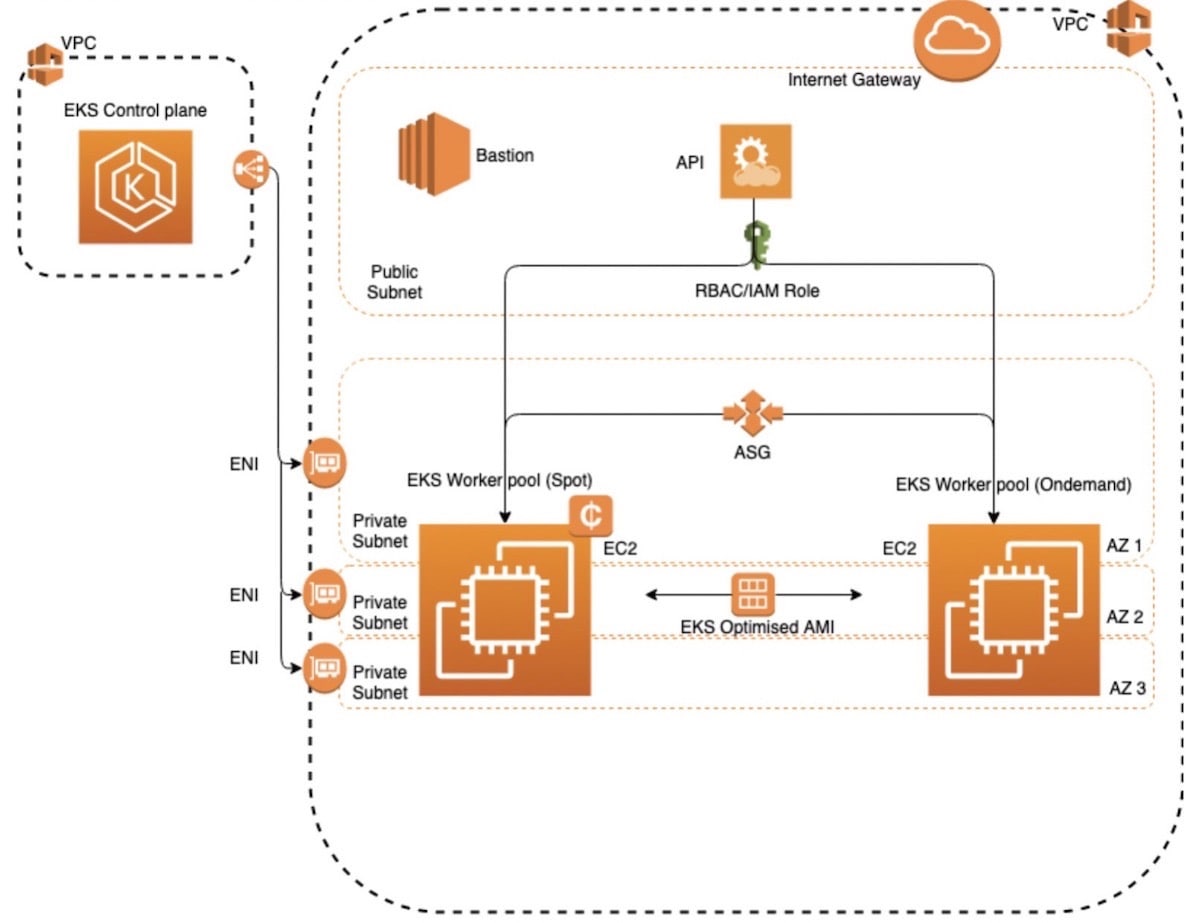
While our custom Kubernetes clusters have been a boon to our DevOps teams, deploying, repairing, and managing them was taking increasingly more time and effort. That’s why we decided to move to Amazon Elastic Kubernetes Service (EKS). Amazon EKS provides us with a stable, managed Kubernetes control plane which includes managed masters and etcd layers. Operationally, this greatly simplifies what we need to maintain and monitor.
Amazon EKS runs in its own virtual private cloud (VPC), allowing us to define our own security groups and network access control lists (ACLs). This provides us with a high level of isolation and helps us build highly secure and reliable applications.
With Amazon EKS, we also make use of Amazon Identity and Access (IAM) users and roles to authenticate with Kubernetes API server and configure the fine-grained access to any Kubernetes namespaces.
As we migrate teams from our custom Kubernetes environment to our EKS environment, we’re currently running on four Amazon Elastic Compute Cloud (EC2) M5.4xlarge instances, which gives us 234 pods that we can run inside of each node. While we currently have a maximum of 10 nodes, they are large enough for 50 to 100 applications, and can autoscale easily. (For those interested in seeing the entire EKS configuration written in Terraform and CloudFormation, you can find it at AWS EKS - kubernetes project.)

Using templates to support fast iteration
We fully templated the deployment of the infrastructure, including custom VPC configuration, EKS control plane, worker nodes, and bastion host using Terraform and CloudFormation. For example, we automatically update worker nodes when a new version of the AMI is available.
We used CloudFormation to automate the process and give us the option to perform rolling updates on the worker nodes. We then use a lifecycle hook to mark each instance that is going to be terminated. At that point, we have an AWS Lambda function that listens to these events and gracefully drains nodes.
(For template examples, check out posts at Marcin’s GitHub account.)
Controlling costs and capacity
We’re using Amazon EC2 Spot instances in our EKS cluster to keep costs down. Spot instances allow you to purchase unused spare compute capacity. This provides us with a substantial cost benefit compared to on-demand pricing, saving us roughly 70%.
However, to use Spot instances, you must make sure that your cluster can scale quickly and that workloads are always fully functioning. Because a Spot instance can be reclaimed by AWS, you need to gracefully drain nodes before they get terminated during interruptions. We solved this by implementing custom interruption handling, which waits for a termination signal and then drains the node.
To manage capacity, we define a resource quota for all namespaces by specifying the CPU and memory that can be consumed. When several users or teams share a cluster with a fixed number of nodes, there is a concern that one team could use more than its fair share of resources. Resource quotas are there to address this concern. Within a namespace, we use resource limits at the pod level to guarantee that one pod or container does not consume all resources from the namespace.
Gaining clear visibility within the cluster
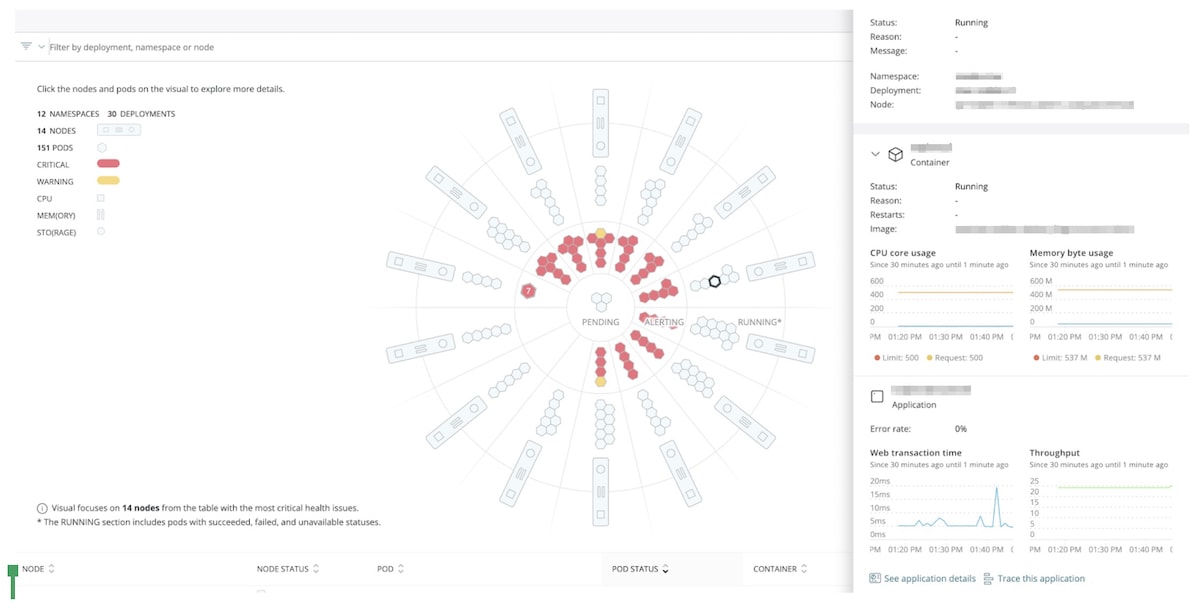
To fully understand what’s going on in our environment, we use New Relic Kubernetes cluster explorer, which is part of New Relic Infrastructure. It gives us visibility into our EKS infrastructure and monitors the health of our AWS environment.
We also use New Relic APM 360, which is fully integrated with the Kubernetes cluster explorer, allowing our DevOps teams to understand whether an underlying infrastructure issue is impacting performance of their application. In the past, we’ve had applications max out the I/O of a particular host, while the memory and CPU were unaffected. New Relic gives our infrastructure and application teams the ability to dive through the entire stack, diagnose the issue, and then resolve it as rapidly as possible.
We use New Relic Alerts for notifications when something is not working as expected, which is applicable to both infrastructure and pods running inside the cluster. We also send Kubernetes logs and events to New Relic, which allows us to have all the information about our cluster in a centralized place. EKS control plane logs, which are normally exported to CloudWatch, are also sent to New Relic.

As we move our custom Kubernetes environments to EKS, the DevOps teams will find it much easier and faster to deploy software. With New Relic, they’ll have full visibility into the health of the infrastructure and how their microservices and applications are performing. Once all the applications are running in EKS, we’ll decommission the existing Kubernetes clusters, which will further reduce our infrastructure costs.
Les opinions exprimées sur ce blog sont celles de l'auteur et ne reflètent pas nécessairement celles de New Relic. Toutes les solutions proposées par l'auteur sont spécifiques à l'environnement et ne font pas partie des solutions commerciales ou du support proposés par New Relic. Veuillez nous rejoindre exclusivement sur l'Explorers Hub (discuss.newrelic.com) pour toute question et assistance concernant cet article de blog. Ce blog peut contenir des liens vers du contenu de sites tiers. En fournissant de tels liens, New Relic n'adopte, ne garantit, n'approuve ou n'approuve pas les informations, vues ou produits disponibles sur ces sites.


