Content delivery networks, or CDNs, accelerate the transfer of assets necessary to load media and other internet content using widely distributed server infrastructures. A CDN is a powerful tool to scale your reach and optimize user experiences, but can also become a “black box” that is difficult to diagnose when issues arise—particularly during high-capacity events.
The ability to monitor CDN performance can be critical in protecting revenue and customer trust. If you provide a streaming service or deliver live events like holiday sales with high traffic, you don’t have time to waste while identifying the origin of latency issues, reacting to fluctuations in traffic volume, or assessing the impact of errors. The longer customers wait for a fix, the more apt they could be to cancel their streaming subscription or shop somewhere else.
CDN performance observability in minutes
We’ve partnered with leading CDN providers Akamai, Amazon CloudFront, Cloudflare, and Fastly to create quickstarts that bundle integration instructions, pre-built dashboards, and alerts to help you start monitoring your CDN’s performance in a matter of minutes. By integrating your CDN with New Relic, you can keep tabs on business-vital performance indicators such as load balancing, latency, availability, and other information in the context of all your telemetry data.
Want more integrations?
- Check out New Relic Instant Observability, our open ecosystem of more than 500 prebuilt quickstarts, which makes it easy to instrument data from any telemetry source.
- Get started with New Relic for free. Your free account includes 100 GB/month of free data ingest, one free full platform user, and unlimited free basic users.
Akamai integration
Akamai uses its distributed cloud platform to enable users to build, run, and secure applications in one place. Akamai DataStream 2 is a real-time log delivery solution that supports sending log files to New Relic for improved log analytics.
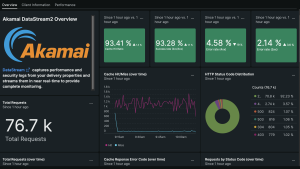
The Akamai DataStream 2 quickstart comes with a pre-built dashboard and 5xx error alert to let you instantly monitor Akamai performance in New Relic, such as cache-hit ratio, and view client information like browser and browser version.
Demo: Set up and deploy the Akamai DataStream 2 quickstart in minutes.
How to set up the Akamai integration
Watch the video above or follow these instructions:
Create a job by making a POST request to the Akamai DataStream 2 endpoint
- Log in to the Akamai Control Center using an account that has access to DataStream 2.
- Navigate to Common Services > DataStream > Create stream.
- Configure your DataStream with a human-readable name, select desired properties, then select Next.
- Choose the data sets you wish to send to New Relic. Under Log format, select JSON. See Akamai’s documentation on data set parameters.
- Select New Relic from the Destination drop-down menu, and configure the destination with these values:
- Display name: Enter your desired description for the destination.
- Endpoint: Enter the New Relic HTTP log ingest endpoint. For the US, use https://log-api.newrelic.com/log/v1, or if you are in the EU, use https://log-api.eu.newrelic.com/log/v1/.
- Auth token: Enter your New Relic API license key, which you can retrieve from the UI or API.
- Select Validate & Save to validate the connection to the destination and save the details you provided.
- After you confirm your push frequency, you'll be able to save the stream and activate the connection on Akamai’s network.
Enable or edit a job in Akamai
- After your DataStream is created, select Proceed to Property Manager > Default Rules to edit and enable the DataStream behavior for each property.
- Select
DataStream 2for the Stream version. - Toggle Enable to
On. - Select the Stream names you created in the last step.
- Specify the percentage of logs data from this property that you wish to stream to New Relic next to Sampling rate.
- Select Save.
- Navigate to the Activate tab and select the version to activate on Akamai’s network.
Install the Akamai quickstart
Open New Relic and navigate to Add data to install the Akamai DataStream 2 quickstart to view a pre-built dashboard, auto-populated with key insights from your log stream data.
Head to Akamai’s documentation to learn about additional options in the Akamai DataStream 2 UI to create a custom header, increase or decrease push frequency, and modify the DataStream behavior in Property Manager.
Amazon CloudFront integration
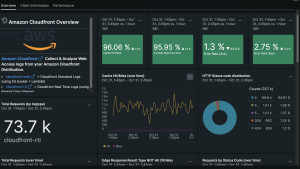
Amazon CloudFront helps their customers securely deliver content with low latency and high transfer speeds by utilizing the purpose-built and feature-rich AWS global network. By integrating your Amazon CloudFront access logs with New Relic, you can track important performance metrics including error rates, request counts, and uploaded/downloaded bytes.
With the Amazon CloudFront quickstart, you can easily explore your data to resolve CDN-related issues faster in New Relic with a pre-built dashboard that visualizes CDN performance and client information.
Demo: Set up and deploy the Amazon CloudFront quickstart in minutes.
How to set up the Amazon Cloudfront integration
Watch the video above or follow these instructions to enable logging from your Amazon CloudFront distribution to send web access logs to New Relic.
To enable this integration, follow standard procedures to Connect AWS services to New Relic.
There are two options for sending logs from Amazon CloudFront: standard logging (access logs), and real-time logs. Instructions and information for both options can be found in our documentation. Steps to enable real-time logging are included in the second section.
Create a Kinesis Data Stream for receiving the CloudFront logs.
- In the AWS Management Console, choose Services > Kinesis.
- Select Data streams, and then Create data stream.
- Enter a Data stream name.
- Select a Data Stream capacity mode of your choice.
- Select Create data stream.
- In the Consumers section, select Process with delivery stream.
- For the Destination, select New Relic.
- Enter a Delivery stream name.
- In the Destination settings section, for the HTTP endpoint URL, select New Relic logs - US or New Relic logs - EU.
- For API key, enter the license key for your New Relic account, which you can retrieve from the UI or API.
- Select Add parameter.
- If you select all fields for logging in step 2 in the next section, for Key, enter
logtypeand for the Value entercloudfront-rtl. If you plan to select a subset of fields for logging (see step 6 in the next section), entercloudfront-rtl-custom.- Find information on how to create a custom parsing rule for your real-time CloudFront logs in our docs.
- In the Backup settings section, you may choose either Failed data only or All data for the Source record backup in Amazon S3 option.
- For the S3 backup bucket, select Browse to search for and select the S3 bucket name you created above for storing CloudFront logs.
- Choose Create delivery stream.
Create a real-time logging configuration and attach it to your CloudFront distribution
- In the AWS Management Console, choose Services > CloudFront.
- In the Telemetry section, select Logs.
- Select the Real-time configurations tab, and then choose Create configuration.
- Enter a configuration name.
- Enter a sampling rate from 1 to 100 percent.
- For Fields, select All fields or choose the fields you wish to include in your logs.
- For Endpoint, select the Data Stream name you created previously.
- In the Distributions section, select your CloudFront distribution ID.
- For Cache behaviors, check Default (*).
- Choose Create configuration.
Install the Amazon CloudFront quickstart
Navigate to Add data in New Relic and install the Amazon CloudFront web logs quickstart to view the pre-built dashboard featuring key metrics from your access logs.

Cloudflare integration
Cloudflare uses its expansive network to make everything you connect to the internet secure, private, fast, and reliable while protecting them from malicious attacks like DDoS. Integrating Cloudflare Logpush with New Relic provides insights into key metrics around web traffic and security, including saved bandwidth, recent threat counts, requests and errors by status, and a broad selection of monitoring features.
The Cloudflare Network Logs quickstart populates this Cloudflare Logpush data on a New Relic dashboard, providing you with an overview of some of the most important performance metric logs from all your websites and applications.
Demo: Set up and deploy the Cloudflare Network Logs quickstart in minutes.
There are two ways to send Cloudflare Logpush data to New Relic: via the Cloudflare dashboard, or alternatively through API. Instructions and information for both options can be found in our documentation. Steps to enable real-time logging are included in the next section.
How to set up the Cloudflare integration via the Cloudflare dashboard
Watch the video above or follow these instructions to learn how to send your Cloudflare logs to New Relic via the Cloudflare dashboard:
- Enable a Logpush service to New Relic
- Log in to the Cloudflare dashboard, and select the Enterprise domain you want to use with Logpush.
- Go to Analytics > Logs.
- Select Connect a service to open the modal window.
- Select the dataset you want to push to a storage service.
- Select the data fields to include in your logs, then Next.
- Under Analytics partners, select New Relic.
- Enter the New Relic HTTP log ingest endpoint. Replace <NR_LICENSE_KEY> with your New Relic license key, which you can retrieve from the UI or API.
- US:
https://log-api.newrelic.com/log/v1?Api-Key=<NR_LICENSE_KEY>&format=cloudflare - EU:
https://log-api.eu.newrelic.com/log/v1?Api-Key=<NR_LICENSE_KEY>&format=cloudflare
- US:
- Select Validate access.
- Select Push.
Install the Cloudflare quickstart
Open New Relic and navigate to Add data to install the Cloudflare Network Logs quickstart to view a pre-built dashboard auto-populated with key insights from your log stream data.
Get started with this log insights solution:
- Learn more about how our partnership with Cloudflare results in faster log delivery and eliminates cloud storage middleware costs on our blog.
- Install the quickstart and get started in minutes.
- Read the integration documentation.
Fastly integration
Fastly's edge cloud platform is designed to take advantage of the modern internet. It’s programmable and supports agile software development with greater visibility and minimal latency—empowering developers to innovate with both performance and security. The Fastly real-time analytics API can send aggregates of metrics including response size, request size, cache hits and misses, and a count of each status code, returning a new set of results with each query.
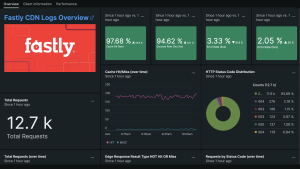
Our Fastly CDN quickstart auto-populates your data into a user-friendly overview within New Relic. It also comes with two alert configurations that will notify you of excessive error counts and slow response times.
Demo: Set up and deploy the Fastly CDN quickstart in minutes.
How to set up the Fastly integration
Watch the video above or follow these instructions:
- To create and enable a job in Fastly, create a New Relic logs endpoint in the Fastly service configuration. Fill out these endpoint fields:
Name: Enter a human-readable name for the endpoint.Placement: Select where the logging call should be placed in the generated. VCL:Format Version Default, waf_debug (waf_debug_log), None. See Fastly’s changing log placement guide.Log format: (Optional) Enter an apache-style string or VCL variables to use for log formatting. See Fastly’s recommended expanded logging format.License key/Insert key: Enter your New Relic license key or Insert API key.
- From Region controls, select the region to stream logs to.
- Select Create to create the new logging endpoint.
- Select Activate to deploy your configuration changes.
Install the Fastly quickstart
Navigate to Add data in New Relic and install the Fastly CDN quickstart to view a pre-built dashboard auto-populated with key insights from your log stream data. Note: this quickstart integration is built on Fastly's expanded log format.
Check out Fastly’s documentation for more information on adding New Relic logs as a logging endpoint, including recommended formatting with examples.
Étapes suivantes
- Explore logging data across your platform by selecting Logs in New Relic.
- Get deeper visibility into both your application and your platform performance data by forwarding your logs with our logs in context capabilities.
- Curious about quickstarts? Watch the walk-through video Installing Your First Quickstart, or explore all the integrations in New Relic I/O.
- Interested in becoming a technology partner? Learn more about New Relic Technology Partners and request to join the partner network.
Les opinions exprimées sur ce blog sont celles de l'auteur et ne reflètent pas nécessairement celles de New Relic. Toutes les solutions proposées par l'auteur sont spécifiques à l'environnement et ne font pas partie des solutions commerciales ou du support proposés par New Relic. Veuillez nous rejoindre exclusivement sur l'Explorers Hub (discuss.newrelic.com) pour toute question et assistance concernant cet article de blog. Ce blog peut contenir des liens vers du contenu de sites tiers. En fournissant de tels liens, New Relic n'adopte, ne garantit, n'approuve ou n'approuve pas les informations, vues ou produits disponibles sur ces sites.
Some solutions offered by the author may be environment-specific and may not be part of the commercial solutions or support offered by New Relic. For questions about the blog’s content, please visit Explorers Hub (discuss.newrelic.com) for community-based answers. This blog may contain links to content on third-party sites. By providing such links, New Relic does not adopt, guarantee, approve or endorse the information, views, or products available on such sites.


