In our journey to bring observability to the mainstream, we open sourced our agents to align on open source standards and remove barriers to telemetry data collection. That includes the New Relic Ruby agent. Most of our users from the Ruby community deploy our Ruby agent to instrument their Ruby on Rails applications, but the agent is so much more than an APM tool.
In this blog post, I’ll show you how to unlock the secret superpowers of the Ruby agent, so you can use it to gain a richer telemetry data reporting experience. I’ll demonstrate how distributed tracing, enhanced error reporting, thread profiling, and logs in context all work together to deliver a powerful observability experience that complements the Ruby agent’s APM features.
Agent install made easy
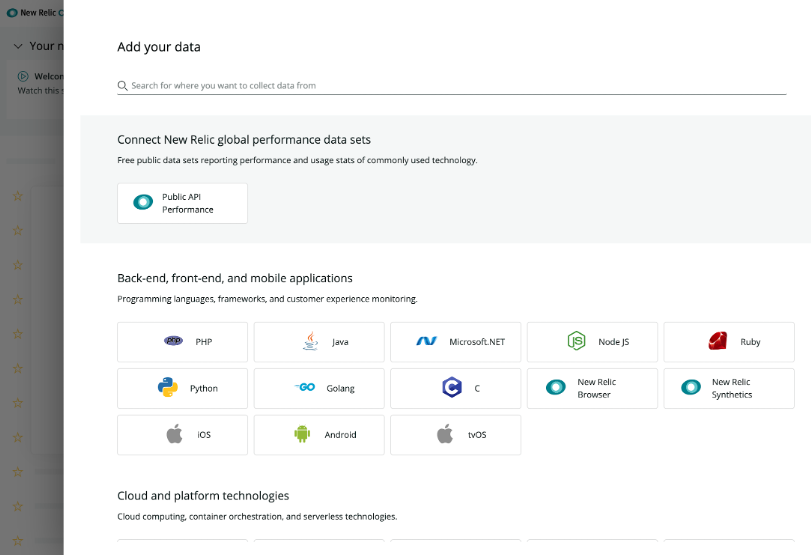
New Relic One delivers a quick and efficient onboarding experience for our agents. To get started, log into New Relic One, and click Add more data.
When prompted, select the Ruby agent:
Follow the prompts, and New Relic will generate a custom newrelic.yml configuration file that you’ll drop into your Ruby application’s config folder. This file gives you everything you need to start sending data to New Relic.
After you configure your app and have it running locally, the onboarding page will automatically update. Click Explore your data to see your telemetry data populate in real time.
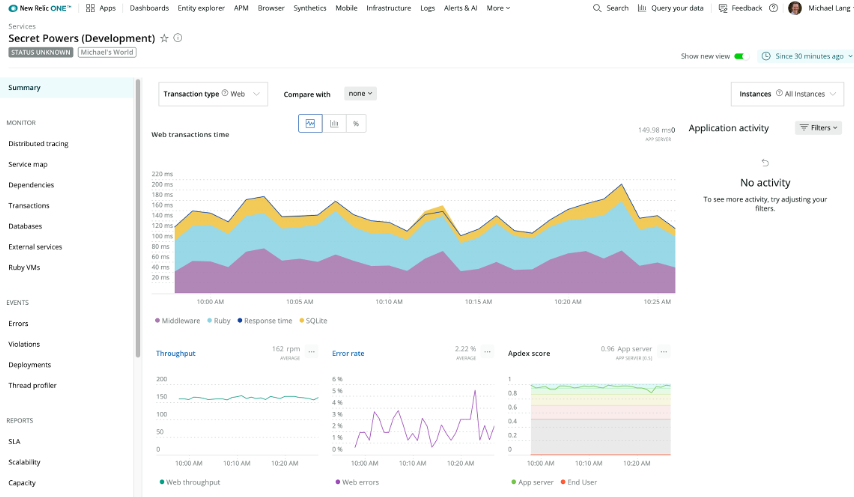
Out of the box, the agent’s default configuration instruments your application and shows transaction-based views of your data, controllers processing page views, API consumption rates, database queries, and more.
Pivoting from transaction-centric views to distributed tracing
Our original APM was a transaction-centric UI for helping Rails developers correlate the Rails stack from the UI. Back then, it was only Rails and most Rails apps were monolithic, so this was a very natural point of view to show users. Today, microservices architectures—and the distributed nature of those services—means a transaction-centric approach makes less sense. This is where distributed tracing comes into play.
To get started with distributed tracing, you’ll need to enable it in your agent’s config file. To do that, add the following in the most appropriate environment section:
distributed_tracing:

  enabled: true
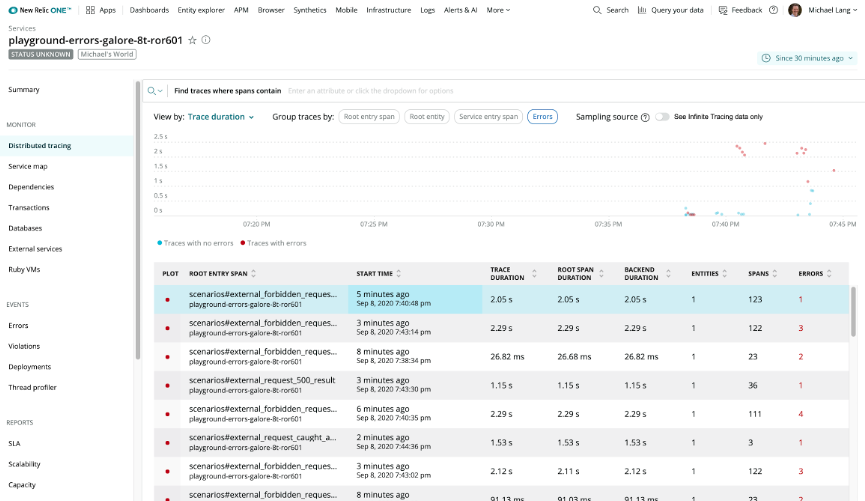
With distributed tracing, you’ll get an intuitive interface to explore all your spans with the ability to group, sort, and filter through real-time data:
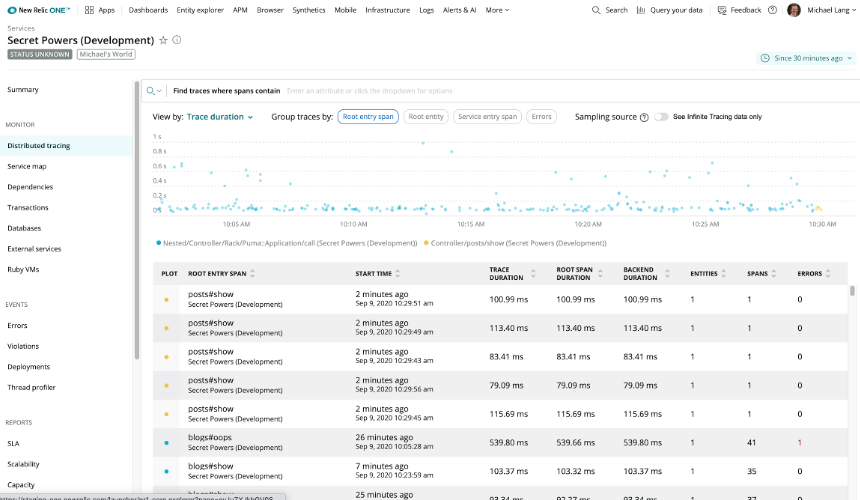
Click a span row to bring up a detailed trace where you can drill down and see what’s happening in a trace and troubleshoot any spans slowing it down.
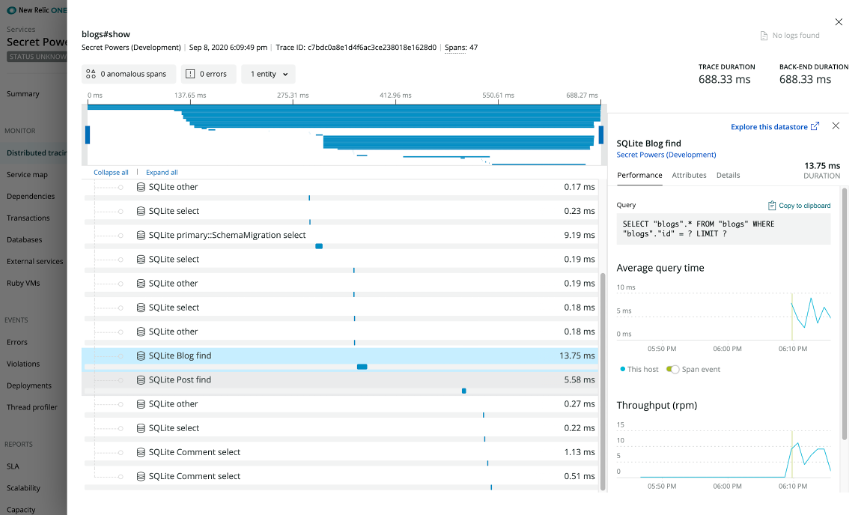
Investigating errors in a Ruby application with distributed tracing
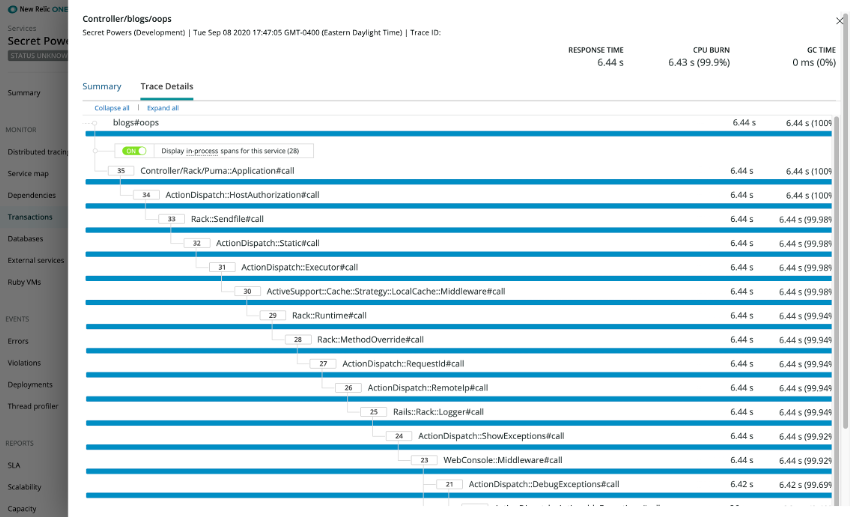
In New Relic distributed tracing, the trace details page shows where errors are occurring and what those errors are at the span level. For example, a traditional trace with an unhandled error might look like this:
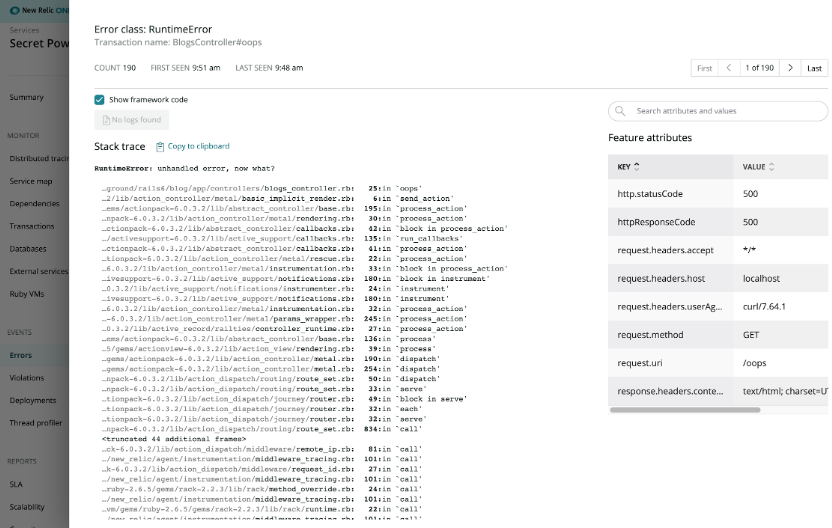
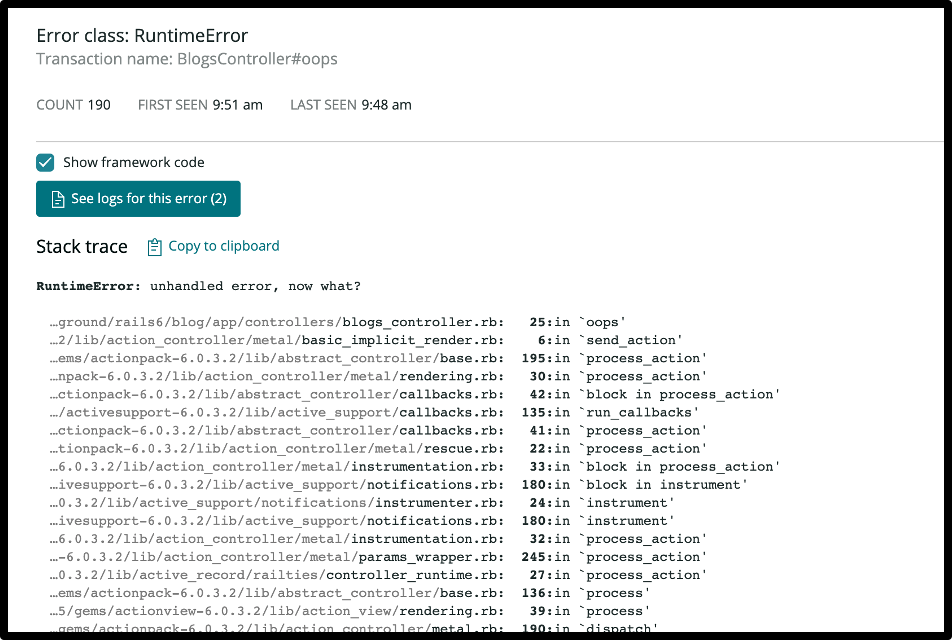
There’s an error in the above trace, but you can’t see it in context of the trace details. To get more details about this error, click Errors (from the Events menu in left sidebar) and bring up the following:
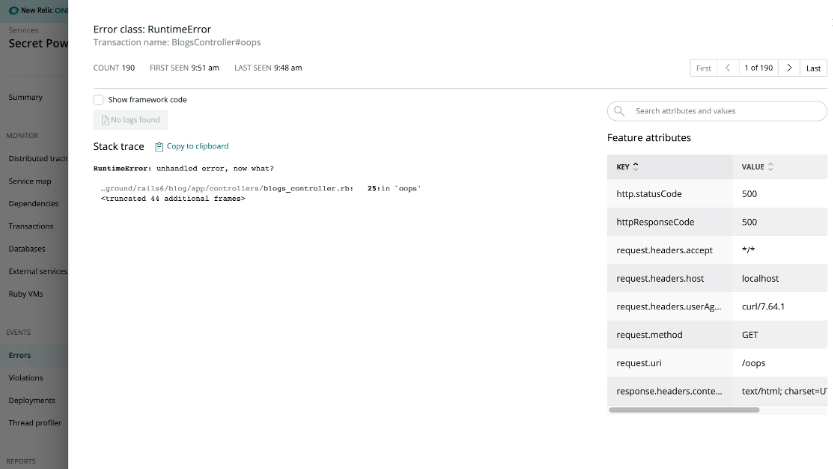
To see the full stack trace of the error, select the Show framework code checkbox:
Stack trace errors are standard in New Relic and a powerful diagnostic tool, but let’s turn on and track errors at the span level. Start by adding the following to your config file:
distributed_tracing:

  enabled: true

span_events:

  enabled: true

  attributes:

    enabled: true
Enabling span_events and attributes for spans gives you richer details about every span in a trace. Enabling attributes is not necessary to see errors at the span level, but it does enrich the details captured with each span even further.
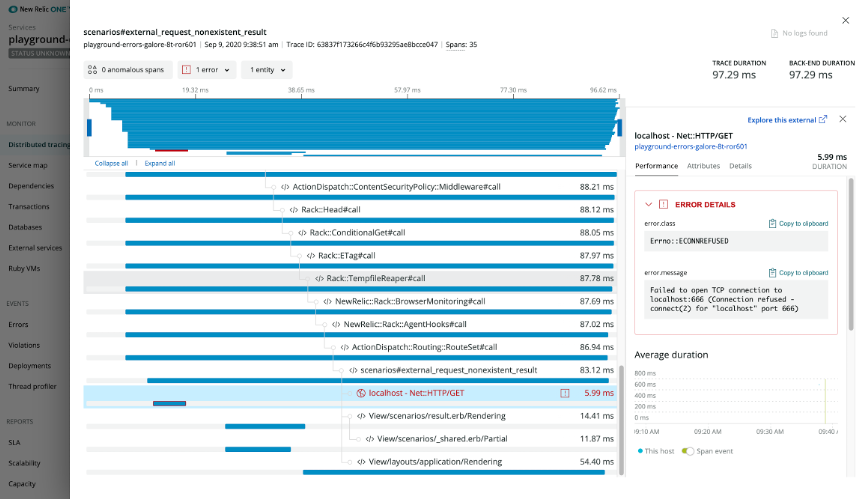
Restart your application and head over to the distributed tracing UI. From the overview of Traces, you can isolate all the traces with errors, which are indicated by red dots, as shown in the following example:
Click any one of the traces to bring up the trace tree, where you can drill down and see exactly where the error occurred and what error/exception New Relic captured. If you navigate into the trace details page, and select the appropriate span, you can see the error/exception that was recorded for that span. You’ll see the red highlights in the graph as well as the span row. If you click the error span, you can get error details in the right sidebar:
Investigating slow performance with thread profiling
Let’s say you find your application consuming 100% CPU for no apparent reason—the thread profiler tool is a great place to start troubleshooting. Turn it on, wait a few minutes for the profiler to warm up, and then start filtering through the results to find the outliers that are driving up those compute cycles.
Let’s go through the steps so you can see just how easy it is to capture a profile.
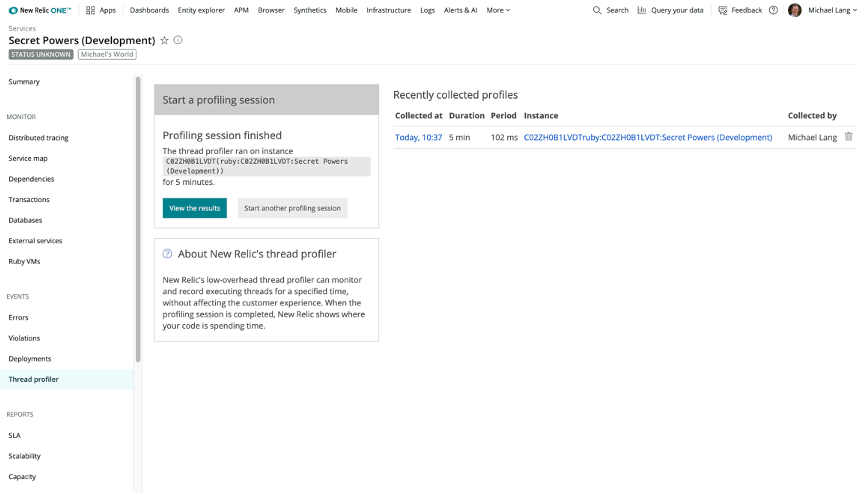
Navigate to the Ruby application in New Relic, and in the left sidebar, click Thread profiler. Select the instance of your deployed application you’d like to profile and click Start profiler.
When it’s done, you’ll see the new profile listed in the Recently collected profiles list:
Select an entry from the profiles list to get a detailed view of that profile; from there you can drill down and explore what’s happening in your application:
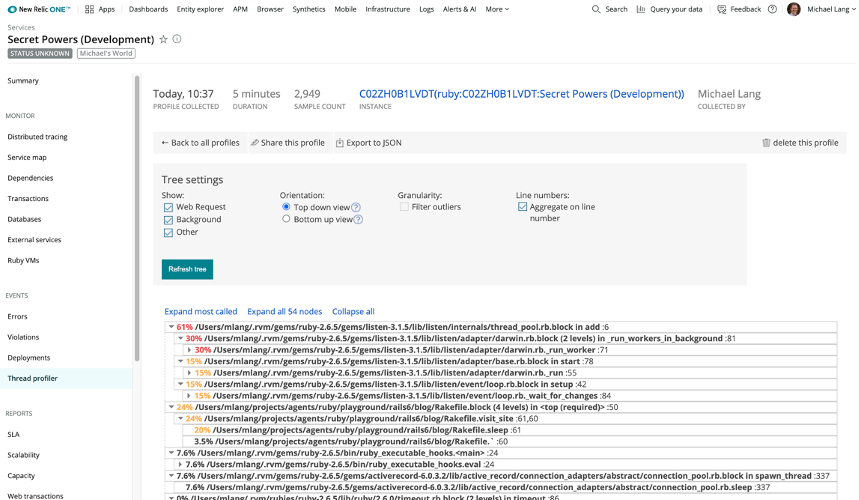
Check out Tips on Using the Thread Profiler for an excellent example on this topic.
Investigating errors in your Ruby application with logs in context
Like metrics and traces, logs are an essential data type for observability. With logs in context, you can link your Ruby application’s log data with related APM data. Let’s take a look at how it works.
The simplest way to enable logs in context with a Ruby on Rails application is to use LogRage to output logs as JSON. You also have to use a log forwarder; Fluentd is a great choice as New Relic provides a plugin that can forward logs—you’ll just need your New Relic license key.
First, add the following to your Gemfile and run bundle install to activate them:
# New Relic RPM

gem 'newrelic_rpm'

gem 'fluent-plugin-newrelic'

gem 'lograge'
Next, add the following to your config/application.rb to set up the logger that will enrich log entries with key attributes and output JSON formatted data to your log files:
module Demo

 class Application < Rails::Application

   # … redacted config (unchanged) ...

   config.lograge.enabled = true

   config.lograge.formatter = Lograge::Formatters::Json.new

   config.log_formatter = ::NewRelic::Agent::Logging::DecoratingFormatter.new

 end

end
There are multiple ways to set up and configure Fluentd in your environment, so be sure to follow our documentation. After you install Fluentd, set up your fluent.conf as follows.
Note: Be sure to set the path to the correct log file and replace YOUR_LICENSE_KEY_HERE, with your New Relic license key.
#Tail the Rails development text/log file

<source>

  @type tail

  format none

  path ./log/development.log

  tag blog

</source>

<match blog>

  @type newrelic

  <buffer>

    flush_interval 10s

  </buffer>

  license_key YOUR_LICENSE_KEY_HERE

</match>
Start the Fluentd daemon and your Rails application, and then navigate to Logs in New Relic One (from the main menu bar at the top) to see log data coming in.
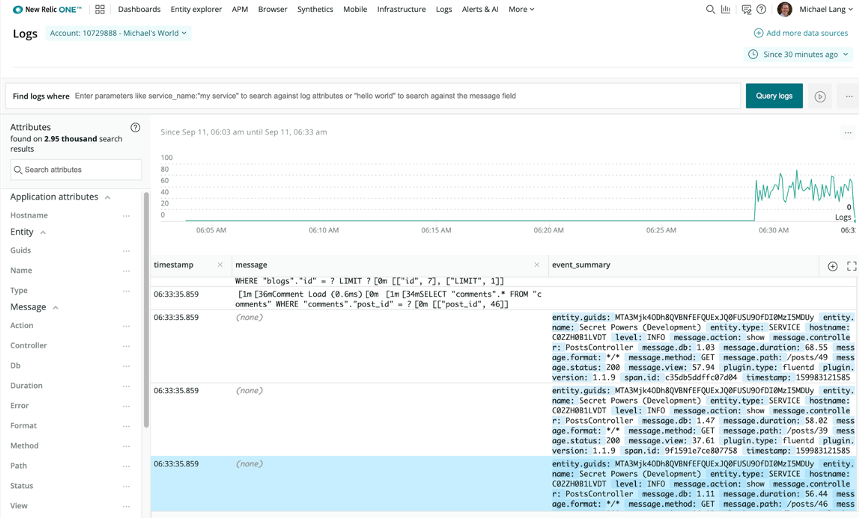
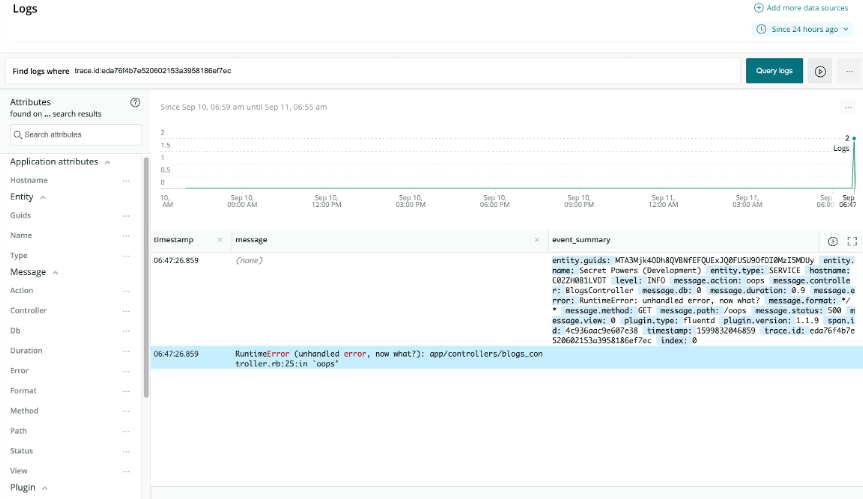
If you’re investigating an error from the Errors page (demonstrated above), and you’ve enabled logs in context, you can get to logs directly from the error details.
Click See logs for this error to view log entries tied to that error event:
To learn more about logs in context, check out this blog post.
Wrapping up
Hopefully, you now have a better idea how the Ruby agent enriches your telemetry data beyond transaction-centric APM. When you send data from your Ruby environment to New Relic One, you’ll get better visibility from performance monitoring, error reporting with complete traces, thread profiling, and logs in context. A single, familiar observability platform like New Relic reduces the hassle factor in debugging, so you can diagnose and isolate issues without ever again having to log directly into a server.
For more tips on getting started or to learn how to extend our platform to better meet your needs, check out New Relic Developers or continue the conversation in the Explorer’s Hub. I love answering questions in our community!
Les opinions exprimées sur ce blog sont celles de l'auteur et ne reflètent pas nécessairement celles de New Relic. Toutes les solutions proposées par l'auteur sont spécifiques à l'environnement et ne font pas partie des solutions commerciales ou du support proposés par New Relic. Veuillez nous rejoindre exclusivement sur l'Explorers Hub (discuss.newrelic.com) pour toute question et assistance concernant cet article de blog. Ce blog peut contenir des liens vers du contenu de sites tiers. En fournissant de tels liens, New Relic n'adopte, ne garantit, n'approuve ou n'approuve pas les informations, vues ou produits disponibles sur ces sites.


