Snowflake, a data platform company that provides a scalable infrastructure in the cloud, can meet a diverse set of needs, from building a data lake to data warehousing, reporting, and analytics. This versatility, plus the benefits of running in the cloud, such as low maintenance and access to massive scale, means that more and more companies are turning to Snowflake.
Like any piece of critical infrastructure, once Snowflake starts to play a key role in delivering value to a company or set of users, it’s critically important to make sure it’s secure, performant, and delivers the data you need in a timely fashion. That sounds like a job for New Relic.
We are introducing our Snowflake integration, which gives you a broad view of how Snowflake is working across the following areas: costs, performance, security, and availability.
In this post, we’ll walk through some key use cases to help you:
- Detect and resolve warehouse performance issues
- Optimize costs—whether that’s expensive queries, users running many queries, or warehouses that contribute the most to your bill
- Detect potential security issues and failed logins
- Monitor and alert on custom Snowflake data
Detect and resolve warehouse performance issues
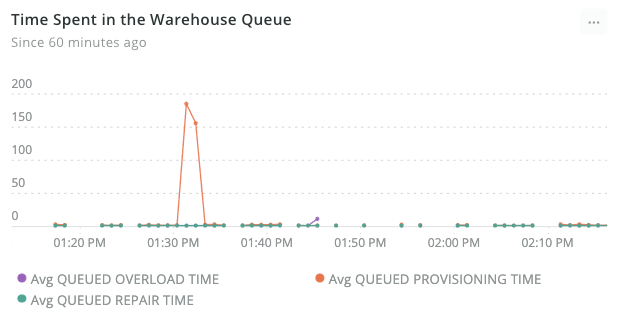
In Snowflake, a virtual warehouse is a massively parallel processing (MPP) cluster, which you can spin up on-demand to execute user queries. Virtual warehouses can be different sizes for different workloads. If a warehouse doesn’t have enough capacity to run the queries in-memory, it will spill some bytes to the disk or remote storage. When this happens, there is a significant impact on query performance.
Keep an eye on these metrics, consider setting up alerts to see when these cases happen, and think about increasing the size of virtual warehouses that experience these symptoms.

Warehouse size also impacts the number of queries that you can process at any one time. A sign that a cluster needs to be resized is when you see disk spillage (bytes spilled to local or remote storage) or queries being queued. Here are two queries you can use to detect each of these scenarios:
SELECT average(BYTES_SPILLED_TO_LOCAL_STORAGE_AVERAGE)FROM SnowflakeVirtualWarehouse WHERE metric_type = 'snowflake.query_performance'
SELECT average(QUEUED_LOAD_AVERAGE) FROM SnowflakeVirtualWarehouse WHERE metric_type = 'snowflake.warehouse_performance'
You can use New Relic Alerts to tell you when a warehouse is queueing queries and should be resized. If an alert triggers, you can resize the warehouse or increase the maximum number of clusters if you have the multi-cluster warehouses setting enabled.
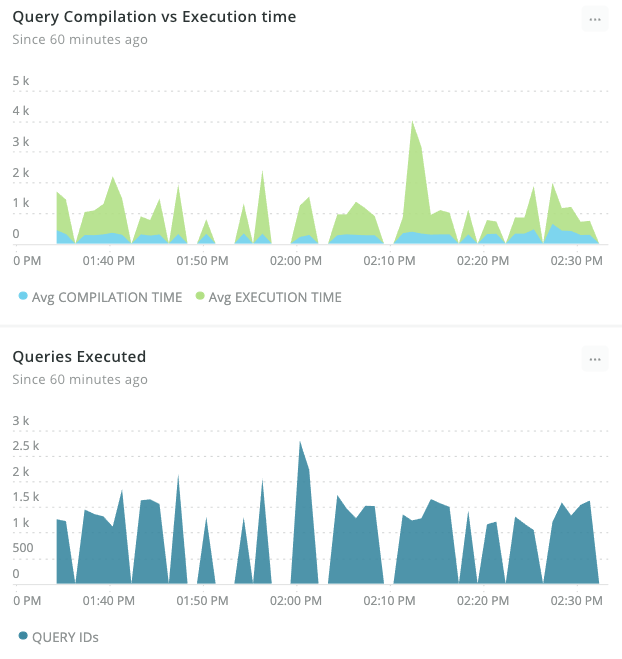
A key area for performance improvements is pinpointing inefficient or poorly written queries. In the chart below, we can detect when Snowflake is spending long periods compiling and executing queries. If you detect a spike in these times, you can dive in further to pinpoint which queries are causing the impact and optimize them to be more efficient.
Optimize costs, credits used
One of Snowflake’s key benefits is its consumption-based pricing model that allows you to spin up new capacity instantly. Of course, with great power comes great responsibility. Like any consumption-based system, it’s easy to spend more than you mean to; that’s why it’s important to keep an eye on costs and alert when spend goes over an acceptable level.
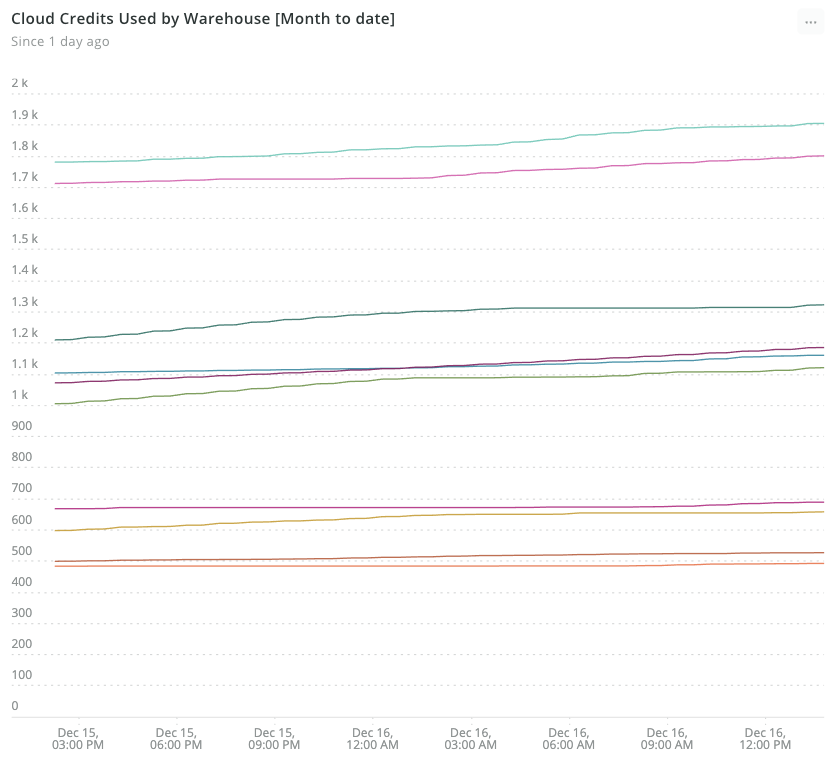
Using a linear prediction function, you can predict when a warehouse spend is likely to reach a certain level in the future based on historical data.
You can also alert when a particular warehouse spend goes over a certain amount using NRQL alerts, which can help you get an instant notification if a spend goes above a certain threshold, preventing an unexpected bill due to user error or misconfiguration.
Detect potential security issues and failed logins
Maintain the security of your Snowflake account by looking at who is logging in. You can track the number of logins, whether they are successful or failed logins, and the method used, such as an ODBC Connector, via the UI or using a programmatic interface such as the Python driver.
A rise in the number of failed logins can indicate that someone is trying to gain unauthorized access to the account or an application or integration that has been misconfigured and could suggest an issue with an application.

Monitoring and alerting custom Snowflake data
Out of the box, the Snowflake integration collects a wide range of performance-related data. What’s more, the integration enables you to ingest any data stored in Snowflake. If you want to keep an eye on orders, revenue, or customer interactions in real time, you can. All you need to do is add a new query to the integration .yml file, and our agent will store the result of that query in New Relic, running at an interval you choose. Check the GitHub repository for further instructions.
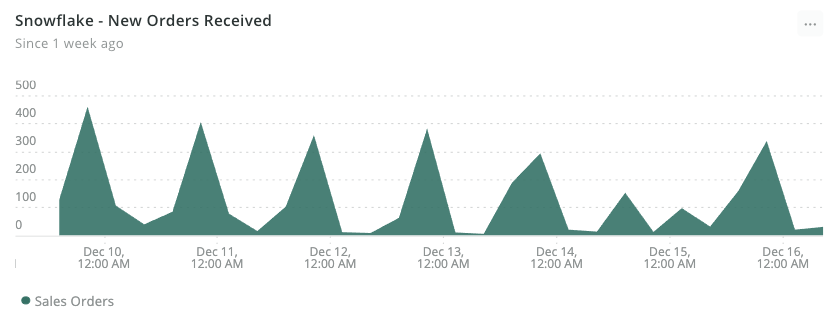
It’s easy to export custom data from Snowflake. Here we see tracking sales orders in real time, alongside the valuable performance data.
Snowflake is becoming ever more popular, but to ensure that its adoption goes smoothly within your organization, you must have a level of observability across different aspects such as performance, costs, and security. If you want to do more with checking performance and metrics, check out how we did this with ZenHub. With the New Relic Snowflake integration, this is easily achievable. Want to learn more? Learn how to implement New Relic on Linux mainframe hardware.
Sign up for a free New Relic account today and start monitoring your Snowflake account.
As opiniões expressas neste blog são de responsabilidade do autor e não refletem necessariamente as opiniões da New Relic. Todas as soluções oferecidas pelo autor são específicas do ambiente e não fazem parte das soluções comerciais ou do suporte oferecido pela New Relic. Junte-se a nós exclusivamente no Explorers Hub ( discuss.newrelic.com ) para perguntas e suporte relacionados a esta postagem do blog. Este blog pode conter links para conteúdo de sites de terceiros. Ao fornecer esses links, a New Relic não adota, garante, aprova ou endossa as informações, visualizações ou produtos disponíveis em tais sites.


