What three pieces are often missing from mobile app development projects? Find out in our free webinar—From App to Stack: Creating Great Mobile Experiences—on Tuesday, May 16 at 2 p.m. ET / 11 a.m. PT. Register now!
Hooray! New Relic’s mobile agents now provide detailed information on every HTTP request made by your mobile app that results in an HTTP error or a network failure. This new data, which is a new default event type named MobileRequestError, allows you to slice and dice network request errors instantly, just like you can with your crashes. It is available to users of the enterprise edition of New Relic Mobile.
What, you might ask, does getting this data actually help you do?
Well, we believe this new event data—which is unaggregated, dimensional data stored in a lossless manner and preindexed across all dimensions—will give you critical information you need to deliver a better user experience. It can also help the frontend and backend teams who support your mobile apps improve their vision up and down a mobile app’s entire stack. This visibility will improve the quality of incident notification and incident response, and can add an additional, important signal for broader mobile performance and mobile business dashboards.
Note that New Relic Mobile customers also have access to the querying, alerting, and charting power of the broader New Relic Digital Intelligence Platform—including New Relic Alerts and New Relic Insights—where this data can be used to optimum advantage.
Crash reporting is not enough
The new MobileRequestError event type is an example of what sets New Relic Mobile apart from mobile crash-reporting point solutions. In the real world, access to the right data is essential to allow your mobile app teams and backend teams to move quickly whenever an issue arises, irrespective if the issue was caused by backend or frontend code.
This is important because modern mobile apps are made up of far more than just the mobile app code; they rely on an increasingly complex set of backend services. If anything goes wrong with even a single backend service, for example, it can impact every user of your mobile app.
Critically, these services may be owned by teams other than the mobile app team. Without a process empowered by the right querying and alerting tools, and the data to respond to these incidents, you can end up with frustrated users and finger pointing between teams when the inevitable issues arise. Your apps’ users don’t care whether it’s some backend service that’s generating an issue. They only know they are receiving a poor experience. And that bad experience can spur them to leave a negative review on the app store, choose to open your app less frequently, even to delete it entirely. Reducing these poor experiences is a critical part of your broader user-retention efforts.
The power of MobileRequestError event data
The ability to instantly query your HTTP errors and network failures can help improve cross-team collaboration while making it easier to highlight a troublesome backend service. Here are a few simple examples, complete with sample NRQL queries and results:
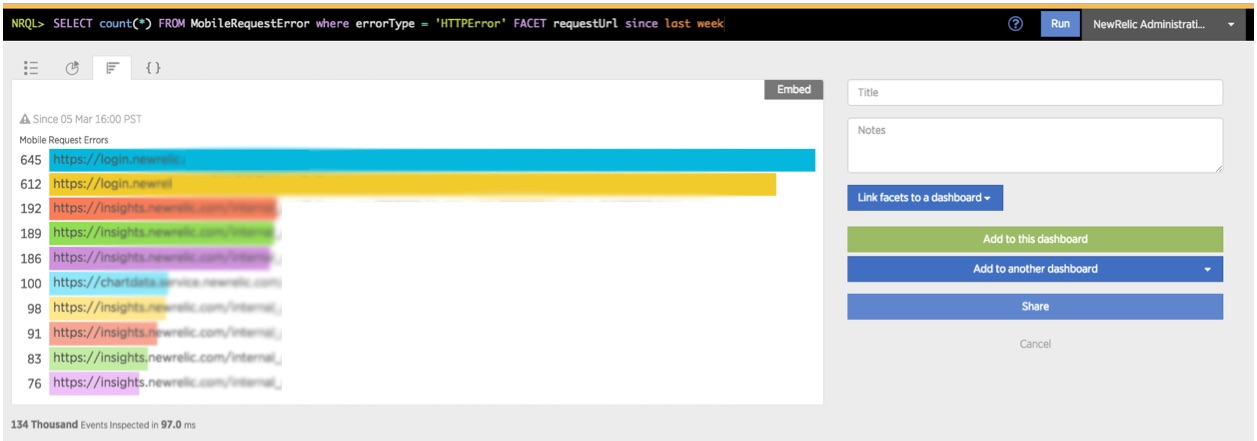
See which backend service is causing the most errors by grouping HTTP errors by backend endpoint, and hand off the information to the right team to address the problem quickly. Did you ever look at New Relic Mobile and wonder what to do with error codes bundled by domain? Did you wish you could see which specific URLs actually experienced the error? Maybe if you thought about it a bit more, you wanted to focus on one particularly crucial backend service? Wouldn’t it be great if you could reach out to the development manager for that backend service and ask what’s going on? Well, now you can. The NRQL query below is an example of how to ask “Which URLs are causing the most errors?”:
SELECT count(*) FROM MobileRequestError where errorType = 'HTTPError' FACET requestUrl

Easily create precise alerts from HTTP errors to reduce noise and respond to incidents faster. Now you can craft precise alerts on the specific backend services you care most about, leveraging NRQL Alerts (now in limited release) and the MobileRequestError event filtering to reduce noise and respond to critical issues faster.
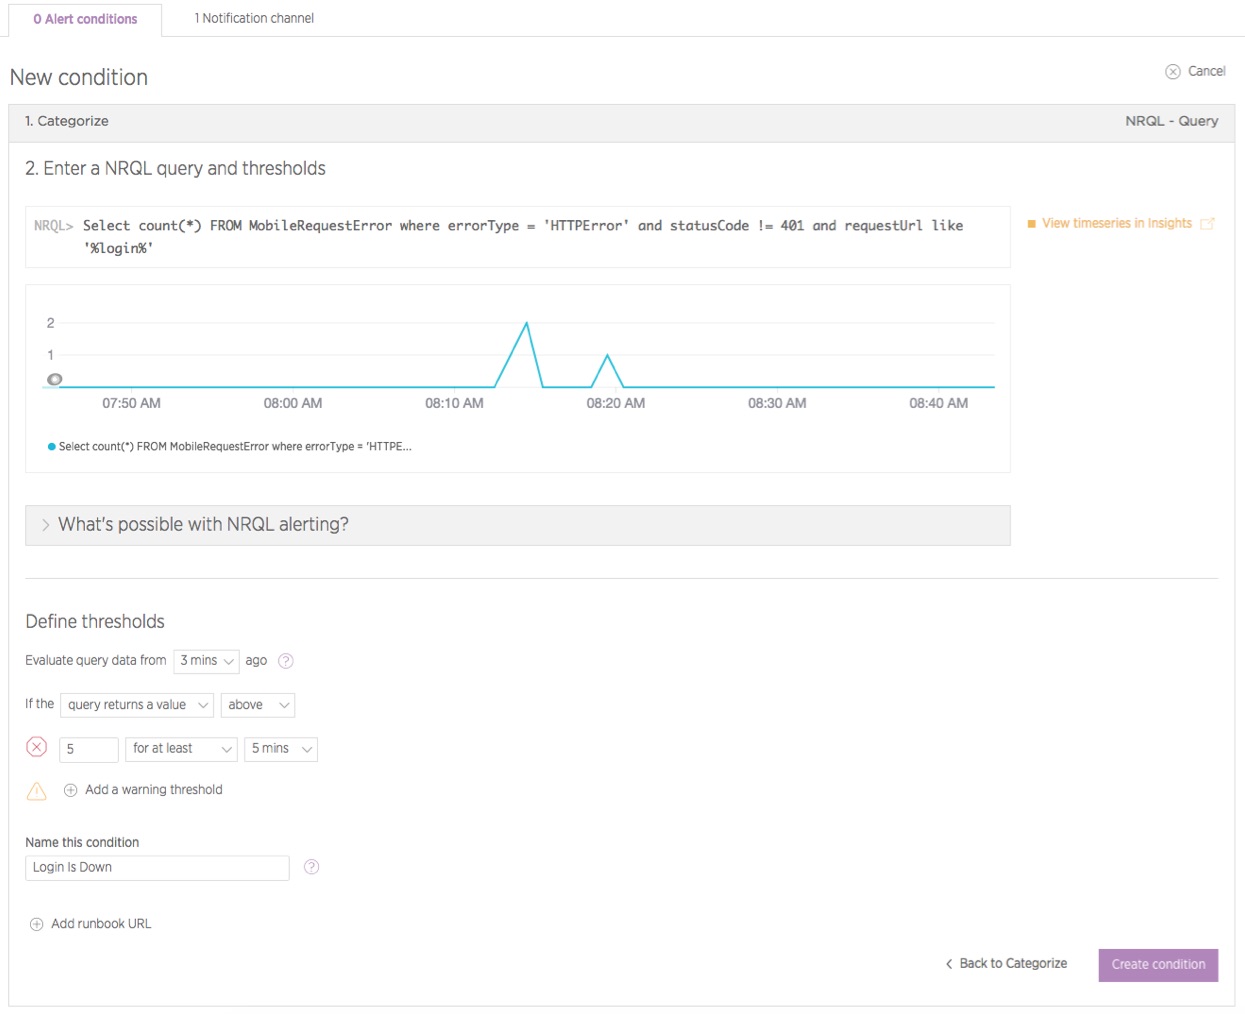
Did you ever look at the errors reported by New Relic Mobile and wish that you could filter out 401s for your login service? Did you wish you could remove them from your error alerts, or alert on them with a different threshold to see only bigger spikes? Well, now you can quickly run an Insights query with this flexibility, and even define a specific NRQL alert with such a filter. In addition, you can make sure that a Slack (or other) alert is received by the mobile team and by the team that owns the service. That way, awareness and collaboration can start as soon as a spike exceeds the selected threshold.
The NRQL query below is an example of how to ask “What number of HTTPErrors were generated that were not 401s since last week?” The second image below the query shows sample results of using the query (without the date clause) to create a precise alert condition to detect when the login service is down:
SELECT count(*) FROM MobileRequestError where errorType = 'HTTPError' and statusCode != 401 and requestUrl like '%login%' since 3 days ago


Use NRQL’s powerful filtering capabilities and the uuid attribute of MobileRequestError to better understand the impact of HTTP errors and prioritize what to fix first. Did you ever wish that you could see whether only a few users or devices were receiving the majority of your app’s errors? Or maybe you’d rather see your error rate based on (# of users impacted) / (total users) so you could filter out the bots for a true sense of the user impact of your errors? The NRQL query below is an example of how to ask “How many users are experiencing errors as compared to my total user count? And how does this compare to one day ago?”:
SELECT filter(uniqueCount(MobileRequestError.uuid), WHERE errorType = 'HTTPError') / uniqueCount(Mobile.uuid) * 100 as '% Users Impacted by Errors' FROM MobileRequestError, Mobile COMPARE WITH 1 day ago

Segment by app version to react more quickly to errors from the latest release and make release day less stressful. You can now drill down into the correlation of app version to issues. Using powerful faceting capabilities in NRQL with the appVersion and appBuild attributes of MobileRequestError, you can better understand the performance of any release, including your most recent one. Did you ever want to see if a particularly frequent error just started happening in the latest app release, or if it occurs regardless of app version or build? Perhaps several versions (or builds) depend on the same backend service and something there recently changed? The two NRQL queries below are examples of how to get the count of HTTP errors by each version of your mobile app or each mobile build:
SELECT count(*) FROM MobileRequestError where errorType = 'HTTPError' FACET appVersion
SELECT count(*) FROM MobileRequestError where errorType = 'HTTPError' FACET appBuild

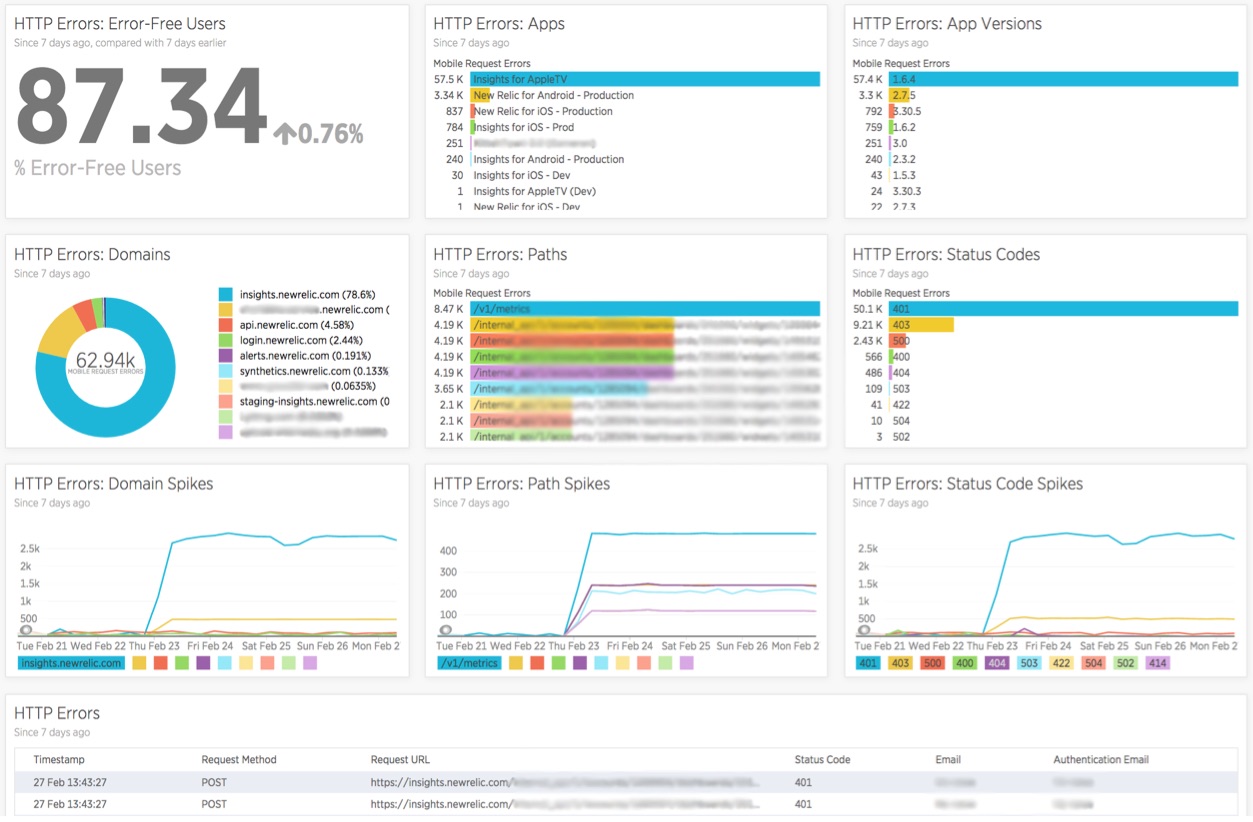
Visualize it all with beautiful dashboards, side by side with other performance and business metrics of your app and its entire stack. With the power of New Relic Insights dashboards, you can chart this HTTP error data with rich visualizations. Then, to go even deeper, combine it with the incredible amount of additional out-of-the-box event and metric data that can be reported by the mobile and other agents in the New Relic Digital Intelligence Platform. You can even include custom attributes, with their vast flexibility, to add new dimensions specific to your business.
Get the complete picture
The release of this new event data, as part of the New Relic Digital Intelligence Platform, shows how New Relic can give you a complete picture of the health of the systems powering your mobile apps, and your user’s experience with your mobile apps in real time.
Ultimately, you can combine the power of this new mobile agent data with our powerful alerting platform, including NRQL Alerts, and the data visualization available in New Relic Insights dashboards, to help make sure your mobile apps are delivering a great user experience.
This New Relic Insights dashboard shows sample visualizations you can create with the MobileRequestError event type:

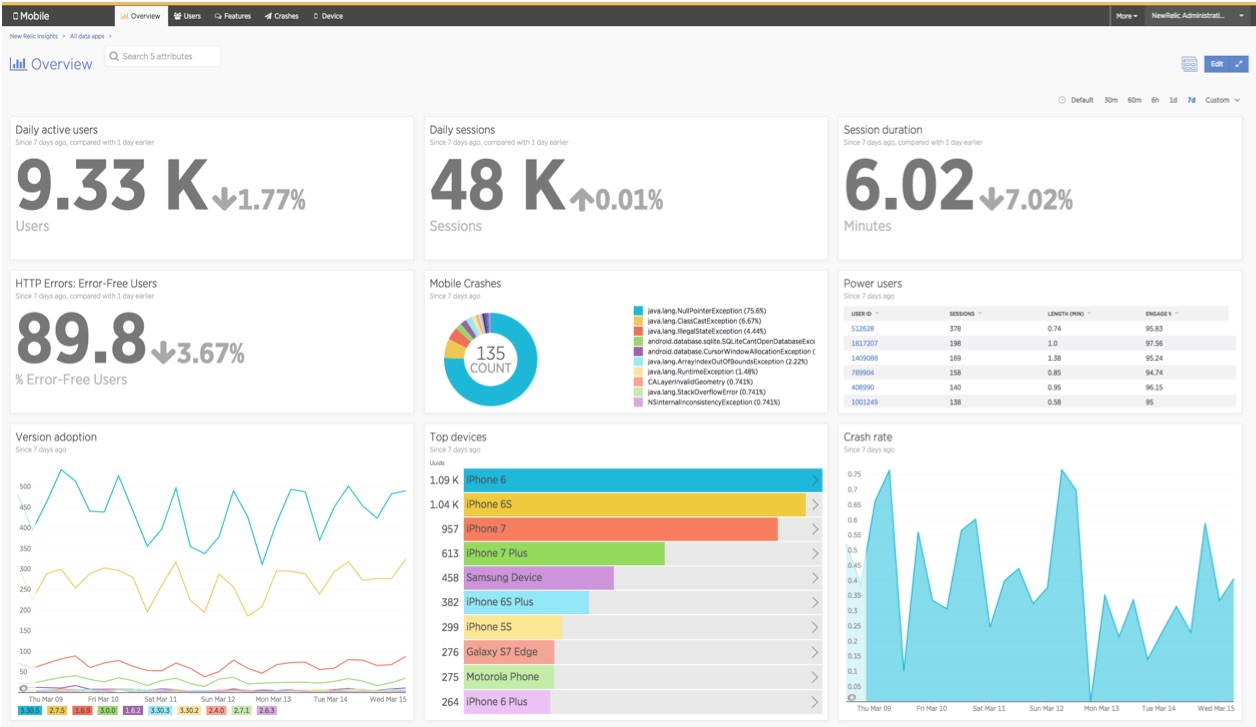
This sample dashboard shows key adoption and performance metrics, including HTTP error rate:

For more examples and information, check out the MobileRequestError documentation.
If you’re an existing New Relic Mobile customer, you can try out these queries today. To make sure all of the attributes for MobileRequestError events are populated for the queries you’d like to run, please ensure you update your iOS and/or Android New Relic Mobile agent to version 5.11.0 or greater. If you’re not yet using New Relic Mobile, you can try it free for 30 days.
Want to learn three of the most common missing pieces we see in mobile app development today? Join our free webinar—From App to Stack: Creating Great Mobile Experiences—on Tuesday, May 16 at 2 p.m. ET / 11 a.m. PT. Register now!
As opiniões expressas neste blog são de responsabilidade do autor e não refletem necessariamente as opiniões da New Relic. Todas as soluções oferecidas pelo autor são específicas do ambiente e não fazem parte das soluções comerciais ou do suporte oferecido pela New Relic. Junte-se a nós exclusivamente no Explorers Hub ( discuss.newrelic.com ) para perguntas e suporte relacionados a esta postagem do blog. Este blog pode conter links para conteúdo de sites de terceiros. Ao fornecer esses links, a New Relic não adota, garante, aprova ou endossa as informações, visualizações ou produtos disponíveis em tais sites.


