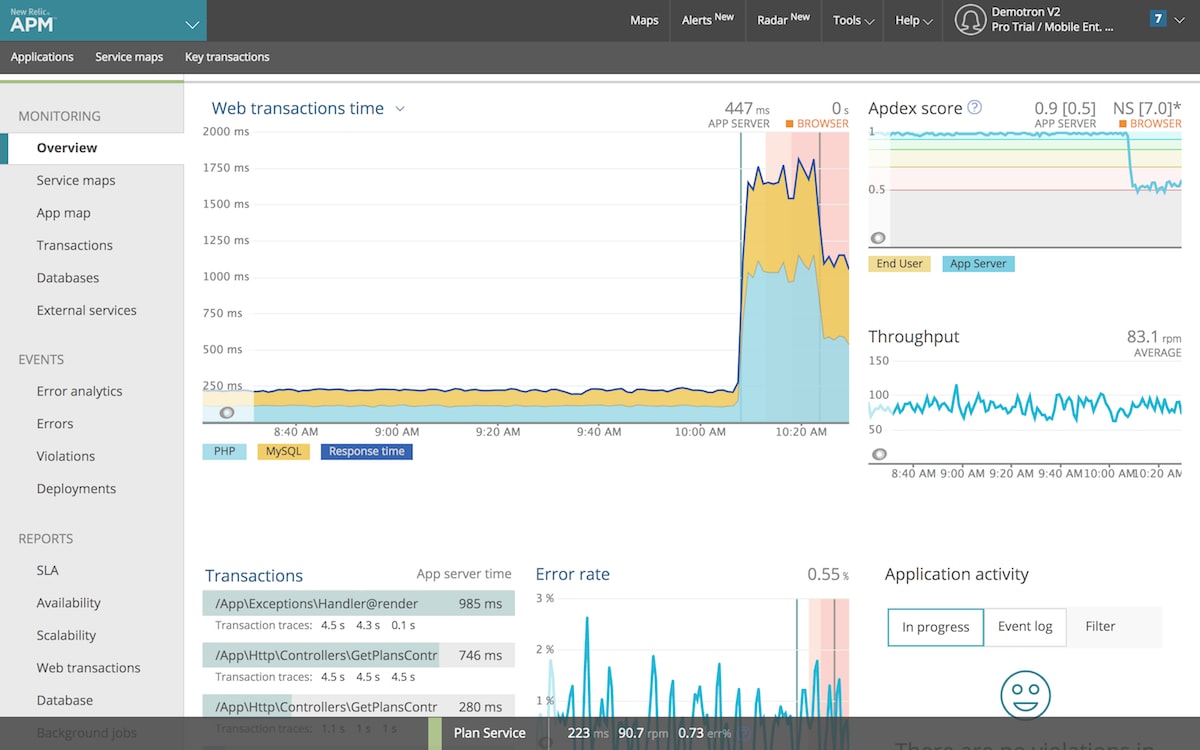
New Relic APM is designed to help modern application teams exploit the latest technology trends to confidently move faster—reducing costly downtime, improving engineer productivity, and enabling high-performing applications.
Delivering on that promise comes down to a set of 10 core capabilities that make New Relic APM the tool of choice to help modern application teams build better software. We’ve listed the highlights in this blog post, but read the full article for all the details:

- Easy-to-set-up real-time instrumentation and analytics. With New Relic’s SaaS model, engineers can quickly get up and running with visualizations that deliver opinionated insights on their applications, whether it’s on-premise or in the public cloud across seven languages, without the need for setting up expensive hardware or complicated custom dashboards.
- Flexible instrumentation and dashboarding. Modern application teams need the flexibility to collect additional data to meet the unique needs of specific applications and industries. The depth of data collected by New Relic out-of-the-box is complemented with several avenues for adding custom instrumentation, including API calls to the agents from inside your source code, XML-based custom instrumentation modules that can be packaged with the deployed applications, and UI-based addition of instrumentation without a code deploy.
- Guides appropriate engineer responses. An APM solution must be able to relay information that guides application teams toward the right response for the issue at hand. New Relic enables alerting on any telemetry collected from the agents, from standard metrics like response time to custom events. But finding and resolving issues before they affect your customers is the ultimate goal. Using multiple techniques including artificial intelligence and machine-learning algorithms, New Relic Applied Intelligence (NRAI) helps guide engineers to the most important performance abnormalities.
- Correlates application performance to end-user experience. Modern application teams need to evaluate the customer impact of performance at every level of the stack from the frontend to the server side. The New Relic platform provides clear visibility into the end-user’s experience through real-user monitoring, synthetic monitoring and mobile app performance analysis to connect frontend performance to server-side performance.
- Connects application and infrastructure performance. As organizations shift to dynamic infrastructure, application health is increasingly tied to the health of the underlying infrastructure. New Relic Health Map provides a prioritized, high-density view of your applications with a clear linkage to the infrastructure hosts upon which the applications depend. If the issue turns out to be on the host, engineers can easily dive into New Relic Infrastructure to further explore the problem.
- Rich, detailed transaction data. New Relic agents use multiple data types to count and measure every single request so that you have performance visibility down to the method level, including metrics, event data, transaction traces, SQL queries, and stack-trace details. And New Relic Insight’s custom query language, NRQL, lets you iteratively query and explore the data in real time.
- Real-time error analysis with on-demand diagnostic tools. New Relic APM agents run inside of applications, so they are uniquely positioned to perform deep diagnostics and profiling. Engineers can slice and dice the errors discovered in their applications over time and save hours of manual analysis. Thanks to the depth of instrumentation provided by New Relic agents, you can see the error stack trace, message, and the line of code from which the error was thrown.
- Integration with DevOps tooling. DevOps success requires not only effective monitoring and measurement, but also a diverse set of capabilities enabled by multiple tools. New Relic APM seamlessly integrates with popular incident-response tools (such as PagerDuty and Slack), major logging tools such as Splunk and Sumo Logic as well as popular configuration-management tools like Chef and Puppet.
- Cloud-service instrumentation. New Relic’s cloud-based platform lets you easily instrument your application at every step. The agents collect detailed application performance data as your app moves from on-premise to the cloud, with no additional configuration required—and it also lets you instrument important cloud services like Amazon DynamoDB.
- Built to scale. Whether it’s Black Friday, Cyber Monday, Game Day, or Election Day, New Relic’s Software-as-a-Service architecture means you never have to worry about provisioning or configuring new servers for your monitoring to handle spikes in traffic.
These 10 capabilities are essential to ensuring that an APM solution meets the needs of modern application teams struggling to adapt to today’s software development trends and challenges.
To find out more, read the full article: 10 Key Capabilities of New Relic APM.
이 블로그에 표현된 견해는 저자의 견해이며 반드시 New Relic의 견해를 반영하는 것은 아닙니다. 저자가 제공하는 모든 솔루션은 환경에 따라 다르며 New Relic에서 제공하는 상용 솔루션이나 지원의 일부가 아닙니다. 이 블로그 게시물과 관련된 질문 및 지원이 필요한 경우 Explorers Hub(discuss.newrelic.com)에서만 참여하십시오. 이 블로그에는 타사 사이트의 콘텐츠에 대한 링크가 포함될 수 있습니다. 이러한 링크를 제공함으로써 New Relic은 해당 사이트에서 사용할 수 있는 정보, 보기 또는 제품을 채택, 보증, 승인 또는 보증하지 않습니다.


