In our previous blog, we explored the essence of DORA metrics, established by Google’s DevOps Research and Assessment (DORA) team, and discussed their role in improving software delivery performance.
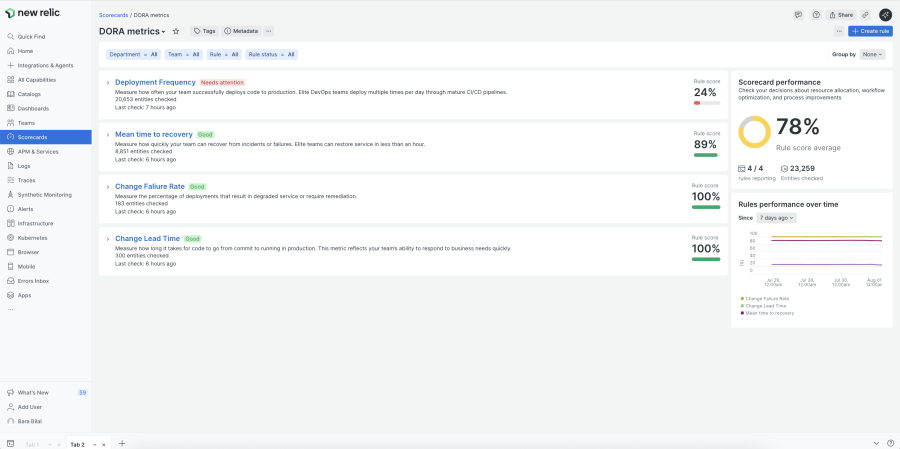
This follow-up dives into how New Relic Scorecards can help you calculate and track DORA metrics automatically—turning your raw engineering and operations data into actionable insights that fuel continuous improvement. Check Scorecards documentation here.

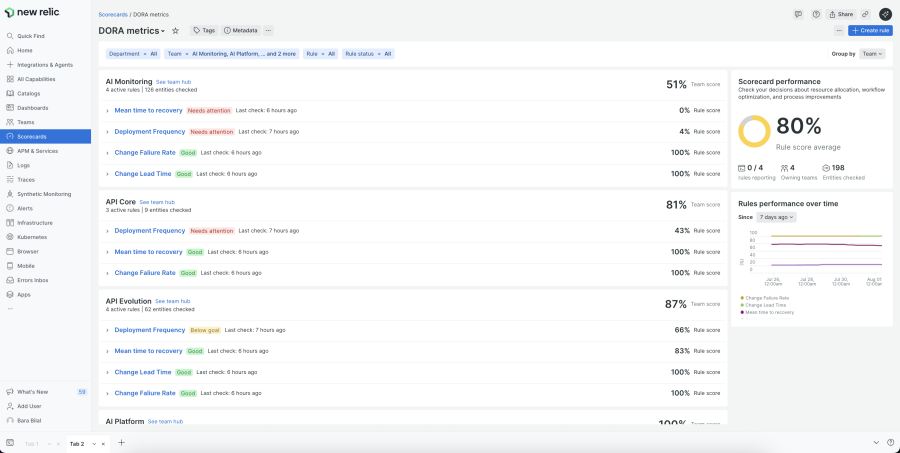
Group DORA Metrics by service ownership and teams.
DORA Metrics Recap
DORA metrics evaluate DevOps performance through four dimensions:
- Deployment Frequency – How often you deploy code to production.
- Lead Time for Changes – How long it takes for committed code to reach production.
- Change Failure Rate – The percentage of deployments that cause incidents or require fixes.
- Mean Time to Recovery (MTTR) – How long it takes to restore service after an incident.
Using New Relic Scorecards for DORA Metrics
New Relic Scorecards provide a structured way to calculate DORA metrics directly from your existing development and operations data.
Getting started is simple:
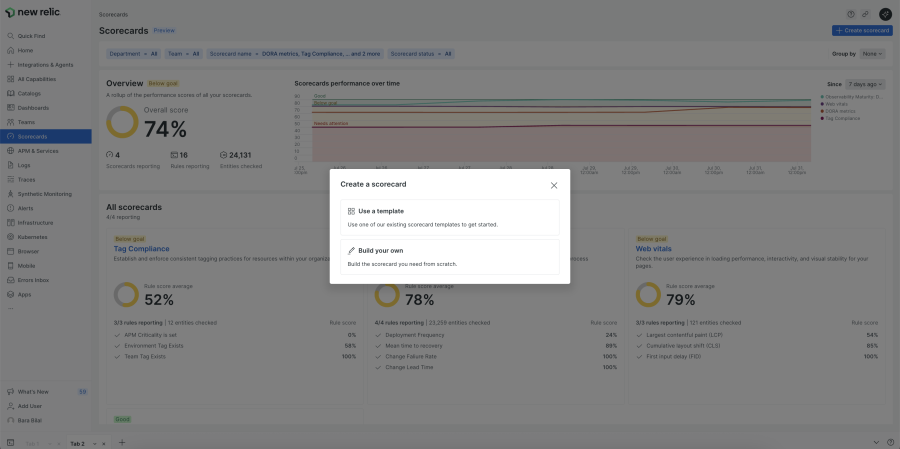
- Navigate to All Capabilities → Scorecards.
- Click Create Scorecard → Use a Template.
- Select DORA Metrics and follow the creation flow.
If you already have the required data in New Relic, the template can produce a fully functional DORA Scorecard with a single click.

Use a template to create a scorecard.
Data Prerequisites
DORA metrics are only as accurate as the data they use. With New Relic, the easiest way to provide this data is through the following integrations and products:
- Change Tracking → Deployment data.
- GitHub Integration → Pull request lifecycle data.
- NR Issues & Incident Management → Incident lifecycle data.
Let’s break down each Scorecard rule, its NRQL query, and how to get the right data.
1. Deployment Frequency - NRQL Query
Data Source - The Deployment Frequency rule requires deployment data. To capture this, use New Relic Change Tracking. You can integrate Change Tracking with your CI/CD pipeline to send deployment events to New Relic via the NerdGraph API.
FROM Entity
LEFT JOIN (
SELECT uniqueCount(deploymentId) AS deployment_count
FROM Deployment
WHERE entity.type = 'APPLICATION' AND entity.domain = 'APM'
FACET entity.guid AS id
SINCE 7 days ago
LIMIT MAX
) ON id
SELECT IF(latest(deployment_count) >= 1, 1, 0) AS score
WHERE type = 'APM-APPLICATION'
FACET id AS entityGuid, tags.nr.team AS 'team'
SINCE last hour
This generates the Deployment event that will contain your deployment data which will be used in the rule, you can query the event using:
FROM Deployment SELECT * SINCE last week
💡 Pro Tip: You need to prepare your CI/CD pipeline to pass the deployed entity (service) GUID and the Commit SHA to the New Relic Change Tracking API. The entity GUID links the deployment to the correct service in New Relic, enabling the calculation of the deployment frequency. The Commit SHA is essential for calculating the Lead Time for Changes. An example here!
2. Lead Time for Changes - NRQL Query
Data Source - The Lead Time for Changes rule requires two data sources:
- Deployment data – from Change Tracking (already covered above).
Pull request lifecycle data – from the New Relic GitHub Integration which syncs your repositories, teams, and pull requests data.
FROM Deployment
LEFT JOIN (
FROM GitHubPullRequest
SELECT latest(codingStart) AS latestMergedCodingStart
WHERE merged = true
AND action = 'closed'
FACET commitSha AS commit
) ON commit
SELECT IF((average(timestamp - latestMergedCodingStart) / 1000 / 60 / 60 / 24) < 1, 1, 0) AS score
SINCE 1 month ago
FACET entity.guid AS entityGuid
It produces the GitHubPullRequest event in your organization storage account, you can query the event to find your new PRs made after setting up the integration using:
FROM GitHubPullRequest SELECT * SINCE last week
💡 Pro Tip: Once your PR is merged a new event will be pushed to the GitHubPullRequest event with the commitSha attribute that will be used to merge on the Deployment event to calculate the time took from the moment the first commit was made until the deployment.
3. Mean Time to Recovery (MTTR) - NRQL Query
Data Source - The MTTR rule needs incident lifecycle data—specifically, incident start and resolution times. Use New Relic Issues & Incident Management to declare and track incidents. When an incident occurs, the system records an NrAiIncident event that the rule uses to average the incident duration to determine your average recovery speed.
FROM Entity
JOIN (
SELECT average(durationSeconds) AS avgDuration
FROM NrAiIncident
WHERE durationSeconds IS NOT NULL
FACET entity.guid
SINCE 30 days ago
LIMIT MAX
) ON id = entity.guid
SELECT IF(latest(avgDuration) < 86400, 1, 0) AS score
FACET id AS entityGuid, tags.nr.team AS 'team'
SINCE last hour
4. Change Failure Rate - NRQL Query
Data Source - The Change Failure Rate rule measures the percentage of deployments that result in fixes or rollbacks - which means you have a deployment that caused an incident or a problem in your environment.
You should already have deployment data from Change Tracking. To make this rule work, you must send a custom attribute isHotfixOrRollback (or any custom attribute you define) attribute in your deployment API call. This flag enables the query to separate normal deployments from those which caused production problems.
💡 Pro Tip: Automate this flag in your CI/CD by tagging rollback/hotfix branches or setting variables in deployment jobs. Additionally, if you would like to use any other attribute don’t forget to change the rule query to reflect that.
FROM Deployment
SELECT percentage(count(*), WHERE isHotfixOrRollback = false)
FACET entity.guid
SINCE 7 days ago
DORA by Team
If you use New Relic Teams, you can easily group DORA metrics by service ownership.
Open your DORA Scorecard, select Group by → Team, and instantly see deployment, change, and recovery performance for each team.

Calculate and track DORA metrics automatically.
Customizing Thresholds and Data Sources
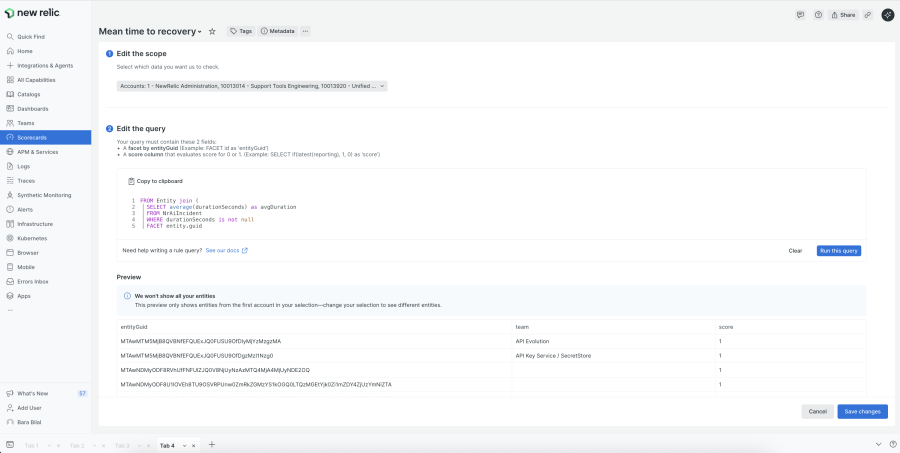
The provided queries follow Google’s High Performance thresholds, but they’re fully editable. Open any rule in your Scorecard, click Edit Rule, and adjust the NRQL thresholds to fit your goals. Additionally, if you are sending any piece of data outside our integrations or products using a custom event, you can modify the query to change the event that has the data.

Customize Thresholds and Data Sources
Étapes suivantes
With the right integrations you can calculate DORA metrics in New Relic Scorecards automatically, without spreadsheets or manual reporting. And DORA is just the beginning. Scorecards include over 10 additional templates for observability maturity, production readiness, and security—all available in a click once your data is flowing. Go To Scorecards now!
New Relic Scorecards is available with the Advanced Compute add-on which provides usage-based access to our new platform innovations. To learn more, contact your New Relic account representative and get started.
Don’t have a New Relic account yet? Sign up for free today. Your free account includes 100 GB/month of data ingest and one full user.
Les opinions exprimées sur ce blog sont celles de l'auteur et ne reflètent pas nécessairement celles de New Relic. Toutes les solutions proposées par l'auteur sont spécifiques à l'environnement et ne font pas partie des solutions commerciales ou du support proposés par New Relic. Veuillez nous rejoindre exclusivement sur l'Explorers Hub (discuss.newrelic.com) pour toute question et assistance concernant cet article de blog. Ce blog peut contenir des liens vers du contenu de sites tiers. En fournissant de tels liens, New Relic n'adopte, ne garantit, n'approuve ou n'approuve pas les informations, vues ou produits disponibles sur ces sites.


