This week at Futurestack 2022, we announced more than 30 capabilities that make it even easier for your teams to monitor, debug, and improve your entire stack—and embed observability practices and telemetry data throughout the entire software development lifecycle.
Here's a comprehensive recap of everything we announced at this year’s FutureStack, and how you can get started with each New Relic enhancement and feature. Interested in seeing all the FutureStack observability innovation for yourself? Sign up for a free New Relic account today so you can spend less time debugging and more time building.
Applications, serverless, ML models
Infinite Tracing for browser, mobile, and serverless traces
New Relic Edge with Infinite Tracing observes 100 percent of your application traces, then visualizes your most actionable data so you can investigate and solve performance issues faster. Infinite Tracing now offers traces from the entire software stack with support for browser, mobile, and AWS Lambda traces. You can now specify the types of browser, mobile, or serverless traces you care about and never miss a trace again. Learn more by reading our press release.
Regional services and Infinite Tracing
Access to Infinite Tracing is now available to all customers in the European Union and Asia-Pacific regions. You can send all your traces to a regional service to decide what data to send to New Relic. This ensures you have a low egress cost for tail-based sampling. Follow the instructions to set up the trace observer to configure regions.
External service monitoring
From the APIs connecting smart home devices to the microservices powering your latest application, it’s difficult to identify the root cause of problems in distributed systems. Our updated application performance monitoring (APM) external services dashboard helps teams diagnose issues with the APIs and microservices powering their application. The dashboard includes a new map view to rapidly identify issues, as well as a list view for comparison and deeper analysis. Learn how to set up external service monitoring.
Machine learning (ML) model monitoring
DevOps and MLOps practitioners can now monitor and visualize critical machine learning model signals alongside their apps and infrastructure, all in one place. Compare the metrics, predictions, dependencies, and system metrics of your entities to understand differences in model performance. You can also filter by model version and track the history of your experiments to learn how code changes impact your models—enabling you to build better models and explain how they work. Read our MLOps documentation to get started.
Infrastructure and network monitoring, Kubernetes with Pixie
Kubernetes experience upgrade
For teams deploying containerized applications on Kubernetes, it can be challenging to understand the relationship between cluster health and application performance. With our new APM interface, you can analyze cluster performance in a single, curated UI, get alerted with a real-time activity stream for Kubernetes events and critical issues, and correlate performance anomalies with one-click logs and side-by-side metrics. Additionally, you can use real-time service, Domain Name System (DNS), and network flows from Pixie to view intra-cluster communication and latency for live debugging on one screen. Get started with Minimize Kubernetes complexity to build performant applications.
Amazon EKS add-on
If you are building on Amazon Elastic Kubernetes Service (EKS) using the Amazon EKS Blueprints Quick Start, you can deploy our Kubernetes observability solution with New Relic’s add-on to EKS Blueprints. This integration helps you automatically deploy observability instrumentation across all your EKS clusters. Understand node capacity and utilization metrics, view container logs in one click, and receive alerts based on system health. With Pixie built in, you get observability using Extended Berkeley Packet Filter (eBPF) with no additional setup. To get started, follow the instructions on the AWS Partner Network blog or watch this brief demo video:
Updated Kubernetes integration
We rearchitected our Kubernetes integration to make it modular and configurable, giving you more flexibility and compatibility with more environments. After you upgrade, you can:
- Get up to 80% memory reduction in big clusters, thanks to an improved kube-state-metrics (KSM) scraping component.
- Triage bugs and fix issues easier with enhanced logs and process cycle.
- Use three individually configurable components, including config files that provide more granular settings for each data source.
- Scrape metrics from components outside your clusters, including Rancher.
- Adjust scraping intervals to suit your needs for ingesting data.
To try it out, read Upgrade your K8s monitoring experience or the Kubernetes integration v.3.0.0 release notes.
Infrastructure monitoring upgrade
Infrastructure monitoring empowers DevOps engineers, SREs, IT Operations, and developers to monitor real-time infrastructure changes proactively and simplify troubleshooting with more operational context. In one integrated experience, see your entire systemwide health at a glance. Identify hot spots and anticipate emerging issues in real-time, visualize topology and relationships for every entity in your application, view all logs in context, and see a visual map that shows the what and when of an incident to pinpoint the root cause quickly. Learn more about how our new infrastructure monitoring experience can help you proactively identify and resolve issues in your public, private, and hybrid cloud infrastructure.
Network performance monitoring update
When system performance suffers, you need to know if it's due to your code, your infrastructure, or the underlying network. Our new network monitoring experiences help you get started by identifying the network-related use cases that are important to your business, onboarding the right network telemetry to address them, and giving you a curated landing page that helps you analyze and understand this newly-ingested telemetry. With these new capabilities, you get:
- Guided, prescriptive onboarding experiences that help you solve real problems.
- Landing pages that highlight key network performance metrics.
- Curated visualizations for analyzing network performance (no network engineering experience required).
Learn how to understand your network performance using curated interfaces and get started with network monitoring docs.
Log management
Logs in context of APM metrics
Accessing logs in the context of APM metrics has consistently been one of the most requested capabilities from our customers, because this contextual data is critical for efficiently troubleshooting performance issues. Now, you no longer need to set up a log forwarder to get the benefits of contextual log details, including automatic log collection and entity context. When you update to our newest Java, .NET, and Ruby APM language agents, you get application logs in context of APM metrics, granular configurations tailored for your billing, and tools that can help address your data privacy needs with the choice to opt-out at any time. Read more on how bringing logs into APM optimizes the logs collection experience while supporting security, compliance, and control—and get started with our latest improvements today.
Automatic logs in context help you troubleshoot applications faster.
RUM and synthetic monitoring
Real user monitoring (RUM) and Core Web Vitals
RUM gives you important insights about how users are interacting with your site. Our browser monitoring all-in-one solution helps you measure and improve application performance and responsiveness for your customers. Recently, we added several new features so you can more easily troubleshoot and optimize your front-end applications.
- Immediately visualize and analyze your application’s load performance, responsiveness, and layout stability, with Google’s Core Web Vitals now incorporated into New Relic’s UI.
- Filter your user traffic across desktop, mobile, and tablet device types, and use intuitive filtering by geography to hone in on your region-specific user data trends.
Read more about the latest updates to browser monitoring.
Updated synthetic monitoring runtime
Synthetic monitoring allows you to proactively test flows through your application so you can detect and fix performance issues before they negatively impact your customers. We updated our synthetics runtime to make browser version updates much easier and more frequent. The added capabilities include async/await support and a custom timing API reduce monitor complexity so you can explore additional synthetic monitoring use cases.
Read more about these new features in our next-generation runtime for synthetic monitoring, or watch this three-minute tutorial:
Errors inbox
OpenTelemetry error tracking
Teams using OpenTelemetry and the OpenTelemetry Protocol (OTLP) to instrument and collect metrics, logs, and trace data can now track and prioritize errors faster. New Relic errors inbox now supports OpenTelemetry-based tracing span data, and its error tracking experience helps you detect, prioritize, and triage errors, with views of errors at both the service and workload level. Plus, with integrations to CodeStream, Jira, and Slack, you can collaborate across teams to triage errors as they arise, before they become issues for your customers.
Read Errors inbox supports OpenTelemetry to learn more about how to get started.
Browser and mobile error tracking
Errors Inbox provides a single place to view, triage, and resolve errors across your full application stack. With our latest release, teams no longer need to set up workloads to track errors from browser and mobile monitoring. Read more about error tracking for browser and mobile monitoring on the what’s new page.
Developer experience, CICD, and topological maps
In-IDE golden signals with CodeStream
Our integration with CodeStream now includes code-level metrics, rich data on golden signals alongside your code. These rich performance metrics help you identify opportunities to improve error rate, latency, traffic, and saturation directly in your IDE using CodeStream. Learn more about how to improve app performance with golden signals in your IDE.
Service level management
Service level management helps you identify SLIs to measure and establish a baseline for SLOs with programmatic data collection. We’ve enhanced New Relic to include a guided SLI and SLO setup, powerful recommendations to get started, metrics customization, and unified health reports, as well as alerting for SLO compliance, error budget tracking, and more. Automatically establish a baseline of service level performance and reliability for any service with recommendations and customizations in a simple, guided flow. Learn more about service level management, including a use case implementation guide, and quick video tutorial.
Customizable navigation
We’ve kicked off a limited preview of our new user experience that includes a fully customizable navigation bar, a global navigation center where you can discover new capabilities to enhance your workflow and increase transparency across your stack, and a collapsible navigation bar for increased screen real estate. We’re also expanding our native collaboration capabilities across the platform so you’ll be able to:
- Host conversations to orient stakeholders around a performance issue for faster troubleshooting.
- Streamline your workflow with key integrations to services like Slack, Teams, Jira, and ServiceNow for increased cross-team efficiency.
- Use a messages center to consolidate and collect active discussions into a single view for ongoing discussions, and to build an evolving knowledge base.
To try the new experience and provide feedback, sign up directly through the New Relic platform today or reach out to your account representative for more information.
Omnimap workload views
You can now use omnimaps to surface relationships and performance health for all of the different relevant entities that make up an application in an easy-to-use, structured interface. Select More in the top navigation, choose Workload views, then select a workload, and select the map tab. Organized by architectural tier, the map automatically groups relevant entities, provides moment-in-time states for the past three hours with the timewarp feature, and surfaces patterns of changing health and anomalous behavior for your entire stack.
Alerts and AIOps
Alert accuracy improvements
Detecting and assessing inconsistent signals is a challenge for many engineering teams. Sliding window aggregation smooths erratic signals to improve the accuracy and visualization of your alerts and alert thresholds, which is useful for particularly volatile signals such as CPU usage on a host. Instead of being notified every time CPU usage rapidly spikes above 90 percent, you can set your condition to trigger an alert if it’s for a configured period of time (for example, five minutes), and visualize the trend. Learn how to configure advanced signal settings for NRQL alert conditions.
Incident intelligence updates
We’ve enhanced our incident intelligence to make it easier to discover issues and receive detailed information, minimizing your resolution time. Our new issues experience includes an analysis summary section with two machine learning modules, golden signals, and related components. You’ll see suggested responders from your team members, impacted entities, and label sets based on third-party sources. In the issues feed, you can use an issue map to investigate impacted entities. Plus, you can see an anomaly overview, deployment events, root cause analysis, an issue timeline. Click any individual issue for more detail, including its analysis summary, event log, and details about correlated issues. Learn how to set up incident intelligence, included with every full platform user seat.
Alert notifications upgrade
We’re making it easier for you to send alerts to your preferred notification tools and refer back to New Relic for incident details. Check out these new and improved destination integrations available in workflows:
- Atlassian Jira: also available in errors inbox
- ServiceNow
- Slack: also available in errors inbox
- Webhook
- PagerDuty
- Amazon Eventbridge
Plus, the notifications log now shows you the history and status of all your past notifications, including related error details and destination ticket numbers. If a notification event fails to send, the consequential errors can be used as event triggers, sending notification elsewhere. Learn how to set up error and alert destinations.
APM and RUM anomaly detection
When something goes wrong with an application or website, you need to know what to look at first, what’s changed, who to notify, and manually specify alert conditions for all of these relevant conditions isn’t feasible. We’ve expanded automatic anomaly detection to include coverage for APM, browser apps, mobile apps, and infrastructure hosts. With no setup required, automatic anomaly detection determines when a signal has changed, automatically correlating incidents and presenting relevant issues directly in your activity streams. Learn more about our expanded anomaly detection.
Security
Security RX
For many modern organizations, the success of their business depends on their ability to minimize risk and close security gaps across their stack. Our upcoming Security RX solutions allow you to surface security vulnerabilities right alongside your observability practice in the New Relic platform. In a matter of minutes, you will be able to easily aggregate existing security data from other tools alongside vulnerabilities detected by New Relic, all in one unified source of truth. By mapping and correlating technical components like containers and runtime libraries, you will be able to understand security signals across your entire stack with a seamless diagnostic experience. And to increase security with less effort, New Relic will allow you to integrate findings directly into ticketing systems so that engineering and Infosec teams can come together to address vulnerabilities across the entire tech stack in pre-production and production environments.
Sign up for a limited preview to New Relic Security RX and help us accelerate secure software delivery. Read New Relic Introduces Security RX to learn more.
Pricing
Data Plus
Beginning on June 1, 2022, customers on our New Relic One pricing model will be able to choose between the existing data offering and a new Data Plus offering, listed at the promotional price of $0.50/GB ingested (includes $1.15/GB of value), to manage data costs when scaling up.
Engineering teams of all sizes get access to industry-leading performance, scale, and governance capabilities—without dealing with complex billing structures, hidden costs, or overage premiums. These additional capabilities include extended data retention, high performance querying, FedRAMP and HIPAA compliance, enhanced data exports, cloud provider choice, and more. Interested in learning more about this option? Read our What’s new to learn more about Data Plus.
Integrations and Instant Observability
Azure multi-cloud support
Our customers often ask for flexibility to run observability workloads on the cloud provider of their choice–and New Relic is now available on Microsoft Azure. Microsoft Azure customers will also be able to use New Relic as their default observability platform by natively integrating New Relic into Azure Portal. You can reduce budgets, store the telemetry data you send to New Relic on Azure, and gain deep visibility into Azure services. Learn more about how our partnership with Azure accelerates enterprise cloud migration and multi-cloud initiatives.
Upcoming observability for cloud migrations
For organizations modernizing their applications and infrastructure, it’s critical for engineers and architects to be able to understand which workloads to prioritize to maximize ROI and minimize risk. Our upcoming AWS Cloud Accelerator will allow you to discover, tag, and organize hosts into workloads to more easily identify rightsizing and modernization candidates to guide your migration strategy. With automatic visibility into your workload and dependencies you’ll be able to make modifications to an app during the migration process to significantly reduce the risks associated with the refactoring/re-architecture migration path, accelerate cloud adoption, and migrate your applications according to your roadmap and priorities.
Instant Observability integration quickstarts
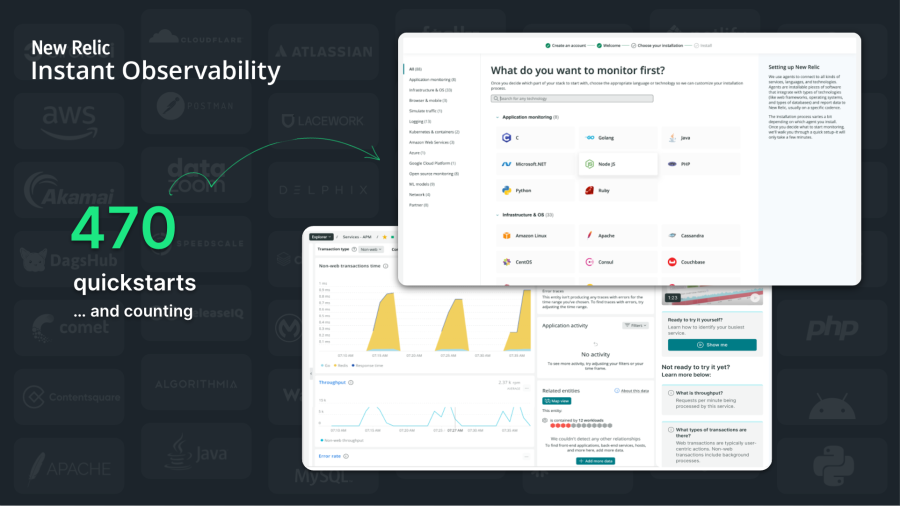
Whether you’re new to monitoring or your organization follows a mature set of observability best practices, it’s simple and fast to monitor the performance of your entire stack. New Relic Instant Observability is our open source ecosystem of quickstarts integrations— preconfigured bundles of dashboards, alert configurations, and guides.
Since launching this ecosystem in 2021, we’ve added integrations with 470+ cloud services, open source tools, and enterprise software. The latest quickstarts, technical integrations, and resources come from leading enterprise technology brands, including Akamai, Atlassian Bitbucket, CircleCI, Cloudflare, Netlify, PagerDuty, and Postman, extending the value of observability to more teams and use cases. Learn about our latest cohort of Instant Observability integrations for monitoring API, network, application, and streaming performance, or read on about how we’ve expanded our observability ecosystem to improve user experience and help extend the value of observability to teams who rely on many tools to monitor the health of their systems.

New data onboarding experience
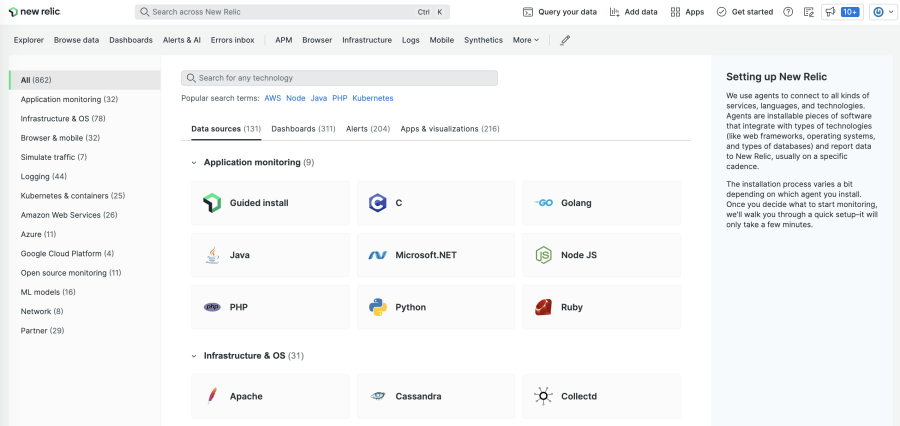
With our improved data onboarding experience, you can now seamlessly instrument and monitor your stacks in minutes, regardless of whether your applications are running on hosts, on Docker, or in other environments. Get more value from your data with connected instrumentation flows that automatically take you to the most relevant New Relic product experiences, such as application performance management, log management, or infrastructure monitoring. Try out the limited preview of this data onboarding experience directly in New Relic.

NRQL and open standards
Enhanced NRQL querying
New enhancements to our querying language, NRQL, help you get broader, deeper, and more powerful insights. As part of our support for OpenTelemetry Protocol, NRQL supports additional complex data types such as simple arrays. Expand the horizons of your queries with cross-account queries through the NerdGraph API, which allow you to query and facet data from up to five accounts all in a single query. The new Regex capture function offers more precise text matching, which gives you a wider range of string manipulation and analysis possibilities.
We’re also fundamentally changing the way you query your data, letting you go deeper and answer more complex questions. Nested aggregations let you query the results of another query with a simple FROM clause. And our newest preview capability, subqueries, takes that one level further—letting you use subqueries in nearly any context a normal value can be used. Learn how to dive deeper into your data with NRQL.
OpenTelemetry
Native OTLP endpoint
The Cloud Native Computing Foundation OpenTelemetry Protocol (OTLP) provides a unified, vendor-neutral standard for instrumentation and transmission of system telemetry. Our native OTLP ingest endpoint makes adoption of this standard easier, enabling you to improve interoperability between tools faster. Our native OTLP endpoint includes support for HTTP/1.1, Infinite Tracing with gRPC, and curated user experiences to visualize and analyze your data.
You can analyze array attributes in NRQL for OpenTelemetry and run NRQL queries with arrays just like other data types, including faceting on array attributes. Also, our updated Java Virtual Machines page for services instrumented with OTLP helps you to identify which service instances have unusual or unhealthy performance patterns and to compare the key service health and JVM metrics across any number of instances.
Read our docs to learn how to visualize OpenTelemetry data in New Relic, or level up in the OpenTelemetry Masterclass.
Community
Public issue tracker
Our connection with our customers is vital to creating the best observability product with a great user experience. You’ll be able to engage directly with our product teams to file feature requests and help influence our roadmap with the new public issue tracker. You will be able to file bugs and feature requests, check the status of issues, receive updates on the issues you care about, vote and comment on issues, and see the various features and bugs that we’re working on. We believe the direct and open connection between you and the folks that work on our product will help make the New Relic experience even better.
Platzi student partnership
We also announced our partnership with Platzi, Latin America's largest online technology education platform that has served more than three million students to date. Platzi aims to increase the pay of Latin American students by teaching them modern software development, which aligns with our mission to empower the world's engineers with a data-driven approach. This partnership will provide more than 5,000 students a professional education in observability in addition to teaching software and cloud engineering. The self-paced courses will be presented in English, Spanish, and Brazilian Portuguese by the end of June 2022.

Próximos pasos
Interested in seeing all the FutureStack observability innovation for yourself? Sign up for a free New Relic account today so you can spend less time debugging and more time building. Your free account includes 100 GB/month of data ingest, one full-platform user, and unlimited basic users.
Las opiniones expresadas en este blog son las del autor y no reflejan necesariamente las opiniones de New Relic. Todas las soluciones ofrecidas por el autor son específicas del entorno y no forman parte de las soluciones comerciales o el soporte ofrecido por New Relic. Únase a nosotros exclusivamente en Explorers Hub ( discus.newrelic.com ) para preguntas y asistencia relacionada con esta publicación de blog. Este blog puede contener enlaces a contenido de sitios de terceros. Al proporcionar dichos enlaces, New Relic no adopta, garantiza, aprueba ni respalda la información, las vistas o los productos disponibles en dichos sitios.
This blog post contains “forward-looking” statements, as that term is defined under the federal securities laws, including but not limited to statements regarding New Relic’s markers, UX updates, vulnerability and/or security management solutions, Azure integration, AWS Cloud Accelerator, public issue tracker, or Platzi partnership, including any future offerings or solutions and platform integration with third-party cloud providers. The achievement or success of the matters covered by such forward-looking statements are based on New Relic’s current assumptions, expectations, and beliefs and are subject to substantial risks, uncertainties, assumptions, and changes in circumstances that may cause New Relic’s actual results, performance, or achievements to differ materially from those expressed or implied in any forward-looking statement. Further information on factors that could affect New Relic’s financial and other results and the forward-looking statements in this press release is included in the filings New Relic makes with the SEC from time to time, including in New Relic’s most recent Form 10-K and Form 10-Q, particularly under the captions “Risk Factors” and “Management’s Discussion and Analysis of Financial Condition and Results of Operations.” Copies of these documents may be obtained by visiting New Relic’s Investor Relations website at http://ir.newrelic.com or the SEC's website at www.sec.gov. New Relic assumes no obligation and does not intend to update these forward-looking statements, except as required by law.


