When system performance suffers, you need to know if it's due to your code, your infrastructure, or the underlying network. And you need to know fast, so you can focus your efforts. With network monitoring and New Relic, you can see how network performance and overall system performance impact each other.
Luckily, networks and their protocols don’t have to be complicated for non-network-savvy engineers and those new to observability. We’ve created an entirely new onboarding experience, helpful landing pages, and curated UIs so you can better understand network monitoring telemetry right away.
These new capabilities identify the network-related use cases that are important to your business, loading the right network telemetry with landing pages that help you analyze the data. With these new network monitoring capabilities, you get:
- Guided, prescriptive onboarding experiences aligned to solving real problems.
- Purpose-built landing pages that highlight key network performance metrics.
- Curated visualizations for analyzing network performance (no network engineering experience required).

Onboarding made easy
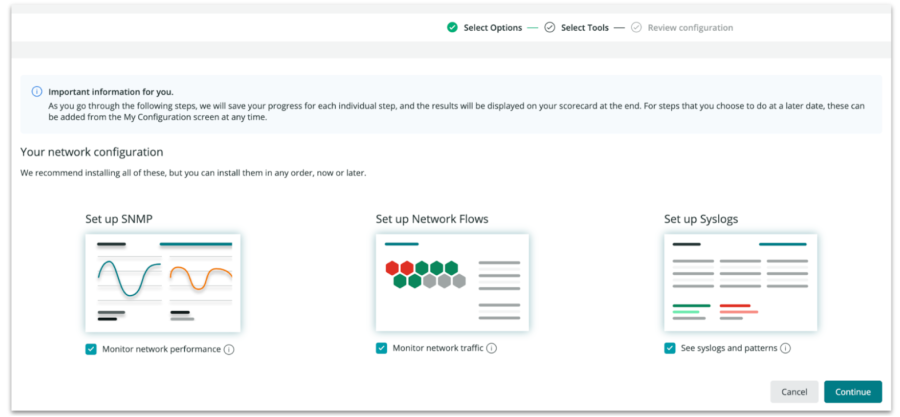
Our new guided onboarding experience walks you through setting up New Relic network integrations step-by-step.
When deploying network monitoring for the first time, just choose one of the tiles to start setting up your network configuration:

You’ll be presented with a few options and a set of commands, which you’ll paste into your terminal to spin up a Docker container, sending your network telemetry to New Relic. When you are ready to send network telemetry, you can be up and running in as little as five minutes!
Purpose-built landing pages
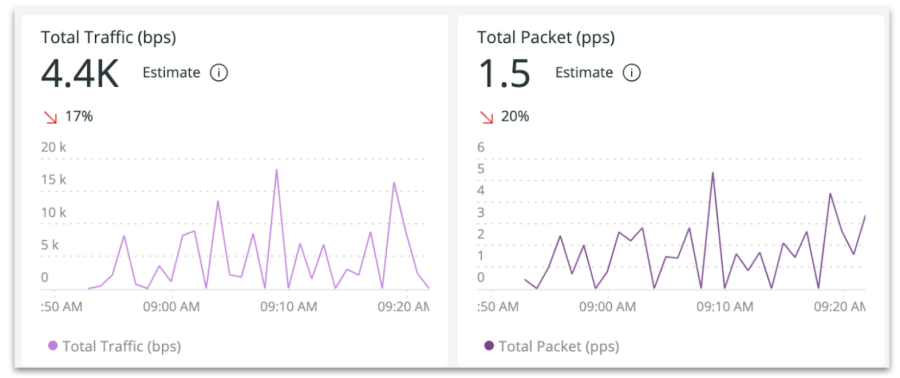
Get a high-level understanding of your network performance, at-a-glance, categorized by the types of network telemetry that you’re monitoring. When your network experiences performance changes, there’s no need to go hunting to find it—we’ll show you right on the landing page.
Landing pages also help you:
- Configure alerts: Set conditions to get alerted when network performance reaches specific thresholds.
- Set up workloads: Categorize sets of entities into logical groupings (including network, application, and infrastructure) to understand how sub-system performance is correlated.

Understand network performance with curated user interfaces
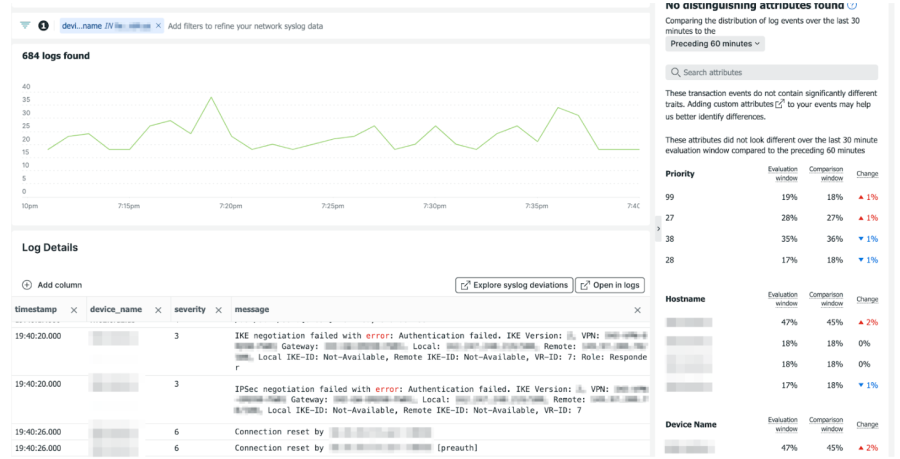
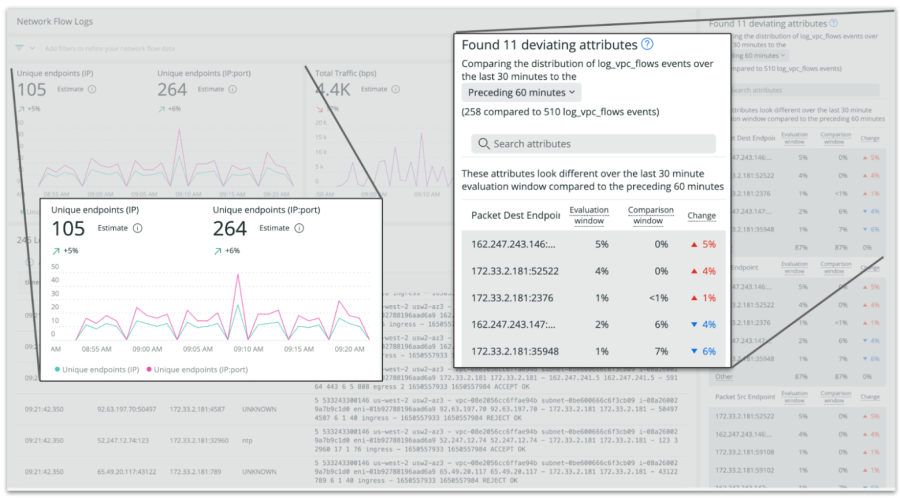
No need to be a network expert building your own dashboards to analyze your network performance. Instead, we provide curated user interfaces for each set of network telemetry that highlight the relevant metrics. Additionally, we’ve brought some of the best capabilities of the New Relic platform to the network monitoring experience, including deviating attributes from Lookout—now available for network syslogs and cloud flow logs.

This helps you quickly understand the changes in your network telemetry, navigate to the differences, and answer the question “Is it the network?”
Próximos pasos
Read the documentation to learn more about how you can use network monitoring to understand how network performance and overall system performance impact each other.
Network monitoring landing pages and curated UIs are available now in New Relic or you can sign up for a free account to try it at newrelic.com/signup. Your free account includes 100 GB/month of data ingest, one full platform user, and unlimited basic users.
Las opiniones expresadas en este blog son las del autor y no reflejan necesariamente las opiniones de New Relic. Todas las soluciones ofrecidas por el autor son específicas del entorno y no forman parte de las soluciones comerciales o el soporte ofrecido por New Relic. Únase a nosotros exclusivamente en Explorers Hub ( discus.newrelic.com ) para preguntas y asistencia relacionada con esta publicación de blog. Este blog puede contener enlaces a contenido de sitios de terceros. Al proporcionar dichos enlaces, New Relic no adopta, garantiza, aprueba ni respalda la información, las vistas o los productos disponibles en dichos sitios.


