Addressing application performance issues during development and before they become major problems is often a reactive and stressful endeavor for engineering teams. With New Relic CodeStream, you can now access relevant performance data and discover issues faster, without having to rely on other teams or end-user reports. Now you can accelerate your release cadence by integrating observability for your development workflows.
When you integrate New Relic CodeStream with your IDE, you can better understand how your code is performing and troubleshoot your applications without compromising your daily development practice. With access to telemetry data at the most granular level right where you work, you get crucial telemetry data without having to leave the IDE.
With New Relic CodeStream you get:
- Code-level metrics, for informed development that allows you to see telemetry data like response time and error rate down to the method level. This helps you identify which function in your codebase is causing issues in your code.
- Service-level telemetry, which gives you access to telemetry data for the services associated with the repo you have open in your IDE, key signals of response time and error rate, and the services it calls to discover errors and vulnerabilities faster.
See New Relic CodeStream in action:
Increase engineering velocity with code-level metrics
Rapid innovation in the software industry is measured by your team’s output and how quickly you can ship high-quality code. CodeStream gives you the information you need to ship better code in less time. The CodeStream IDE extension is an always-on view of telemetry data that brings software performance into the daily practice of developers. Code-level metrics showcase the response time and error rate—displayed as a line of text above each method in your code in the IDE to help you improve the quality and reliability of your application.
Metrics are shown for the last 30 minutes, and include the sample size from that timeframe.

Also, clicking on each of the metrics brings you to a set of charts visualizing the metrics. You can also get more insight by clicking through to the APM service summary page in New Relic.
Here’s an example.
You can even change which service the metrics are pulled from to see how your code is performing in lower-level environments, such as staging or QA, to take a more proactive approach to performance problems. With these metrics, you can optimize your development lifecycle by getting ahead of these issues before they hit your customers and affect your bottom line.

Shift to data-driven code reviews
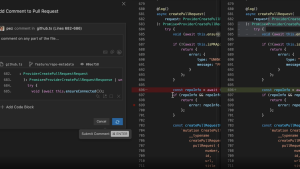
With CodeStream, you can now see code-level metrics in your diff view for both pull requests and feedback requests to help drive more informative code reviews. This feature ensures excellence in the code you’re rolling out, improving the code review process by letting you know how performant your code is.

If there are performance issues, you can ensure they're addressed as part of the pull request. There's no better time to address outstanding performance issues if the code is already changing, and you can easily send it back before it affects your users.
Identify and resolve issues faster with service-level telemetry
In addition to code-level metrics above each method, and in your PRs and feedback requests, you also get a view of how all your services are working together. When it comes to ensuring the overall health of your services, getting the “big picture” of how everything is working in relation to each other is extremely important for quickly identifying and responding to critical incidents that might occur.
Reliance on IT/Ops teams to report issues was a common approach. New Relic CodeStream shifts the old way of doing things by giving you access to performance information under the observability section.

Here you can now access:
- Golden metrics: the key signals of response time and error rate, which indicate how the service is performing.
- Service level objectives (SLOs): comparison between service performance and any SLOs that have been defined.
- Vulnerabilities: vulnerabilities from the New Relic Security RX service that are related to your repo.
- Related services: golden metrics for any service that calls, or is called by, your service.
- Errors: recent errors happening in your service, so you can navigate the stack trace to find the problem, and collaborate with teammates on resolution.
Getting started with New Relic CodeStream
Ready to get started? Follow these instructions to get CodeStream integrated in your IDE. Frameworks currently include Python, Ruby, .NET, Java, PHP, Node.js and Go.
Don’t have a New Relic account yet? Sign up for a free account.
1. Install our latest APM agent
Get CodeStream along with 30+ capabilities from New Relic when you install or update your APM agent to the version that supports code-level metrics.
Note: For Node.js and Go agents, you’ll also need to enable code-level metrics when configuring the agents. Check out the documentation for the specific agent requirements.
2. Install the CodeStream extension
Install the CodeStream extension by going to the marketplace in your IDE. Make sure you’re running the latest version:
3. Sign up for CodeStream
After installing the extension, you’ll be prompted to create a CodeStream account, even if you’re already a New Relic user.
Select Sign up with New Relic. And you’ll be prompted to enter your New Relic User API Key. After you provide the API key, you’ll be signed up for CodeStream and connected to your New Relic account.
4. Associate a repository with your APM service
Open a repository in your IDE that corresponds to an APM service where you’d like to see code-level metrics. If the repository isn’t already associated with the APM service, you’ll get this message in the observability section of CodeStream prompting you to select a New Relic entity and associate it to the repo.

You might have multiple services that correspond to this repository (such as different services for different environments). You can make additional repo<>service associations on the Summary page for your APM service in New Relic. Go to the Repositories section in the bottom right.
5. Open a file and look for each CodeLens
Open a source file from your repository and look for the golden metrics in a CodeLens above each instrumented method.

Próximos pasos
Now you have access to detailed insights on how your code is performing at the method level in context with observability metrics so you can proactively improve and fix your code in shorter cycles.
To learn more about what you can do with CodeStream, see the CodeStream user guide.
If you're not using New Relic yet, sign up for a free account. It includes 100 GB/month of free data ingest, one free full-access user, and unlimited free basic users.
Las opiniones expresadas en este blog son las del autor y no reflejan necesariamente las opiniones de New Relic. Todas las soluciones ofrecidas por el autor son específicas del entorno y no forman parte de las soluciones comerciales o el soporte ofrecido por New Relic. Únase a nosotros exclusivamente en Explorers Hub ( discus.newrelic.com ) para preguntas y asistencia relacionada con esta publicación de blog. Este blog puede contener enlaces a contenido de sitios de terceros. Al proporcionar dichos enlaces, New Relic no adopta, garantiza, aprueba ni respalda la información, las vistas o los productos disponibles en dichos sitios.


