At the heart of any business is building a great customer experience. Building resilient products is half the battle. Software development teams also need observability into their applications and the tools they depend on to run.
Cloudflare protects their customers’ applications through application services, such as DNS, CDN, WAF, and Bot Management. Cloudflare Zero Trust product offerings like Access and Gateway create safer and faster access to corporate resources. To give visibility to extract insights, Cloudflare provides analytics and logs for their products. But many teams use other applications and network services in addition to Cloudflare and want to be able to correlate data through all of their systems.
The process of managing a variety of applications, infrastructure, and cloud platforms is painful and needlessly complex. It might involve wading through individual log files or building custom searches. You lack both the flexibility and time to reconcile multiple platforms. Now, there is a more integrated solution to circumvent those common frustrations.
Introducing the Cloudflare and New Relic log integration
Our new partnership between Cloudflare and New Relic creates a direct integration between New Relic One and Cloudflare Logpush. With this new integration, you no longer need any middleware to get Cloudflare data into New Relic One. This results in faster log delivery and eliminates cloud storage middleware costs for better log management.
Visibility into logs and analytics should be an easy and seamless process. The Cloudflare Logpush integration makes it easy to monitor key metrics around your web traffic, including saved bandwidth, alerts on cyberattacks, a ranking for fastest and slowest loading pages, and a broad selection of monitoring features—all within a few clicks.
Need to brush up more on log integration? Learn how to import Google Cloud logs without an agent.
To learn more about the new integration with Cloudflare Logpush and start using it today, check out these links:
- Install the quickstart and get started in minutes.
- Read the integration documentation.
- If you’re not already using New Relic One, get started for free. Your free account includes 100 GB/month of free data ingest, one free full-access user, and unlimited free basic users.
- If you’re not already using Cloudflare, get started with Cloudfare enterprise plans.
What is Cloudflare Logpush?
It’s important for Cloudflare and the organizations that use Cloudflare to both provide an excellent user experience to application end users and keep security threats at bay. This is hard to do without a deep understanding of traffic-down to the individual request. Cloudflare exposes logs using a product called Logpush.
Development teams use these logs to debug, to identify configuration adjustments to improve performance and security, and to create custom analytics. Logs can also be combined with other data sources to provide security and infrastructure teams with end-to-end visibility.
How to send logs to New Relic One with the Cloudflare integration
To help you get the most of the new Cloudflare Logpush integration with New Relic One, we created the Cloudflare quickstart in New Relic Instant Observability (I/O). This quickstart integration enables you to monitor and analyze web traffic metrics on a single pre-built dashboard, integrating with the New Relic One database to provide an at-a-glance overview of the most important logs and metrics from your websites and applications.
Getting started is simple:
- Make sure you have set up New Relic and Cloudflare accounts. If you aren’t already using New Relic One, get a free account. (2 minutes)
- Next, enable pushing logs directly from Cloudflare to New Relic One. You can do this either through the Cloudflare dashboard or an API. Follow the steps in the Enable Logpush to New Relic documentation. (5 minutes)
- Now that you’ve enabled logs to flow from Cloudflare to New Relic One, install the quickstart to get a curated New Relic One dashboard. Go to the Cloudflare quickstart in New Relic I/O, click the + Install quickstart button, and follow the guided install process. (2 minutes)
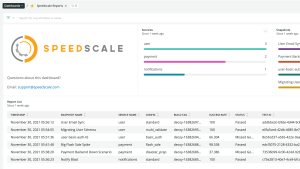
After you have installed the Cloudflare quickstart, you automatically get a pre-curated dashboard where you can see key metrics from your Cloudflare network logs. Here’s an example:

Visibility into logs and analytics should be an easy and seamless process. The Cloudflare integration with New Relic One helps provide insight into key metrics around web traffic, including saved bandwidth, alerts on cyberattacks, a ranking for your fastest and slowest loading pages, and a broad selection of monitoring features.
Próximos pasos
- Get started with Cloudflare.
- Read the Cloudflare blog post for Security Week.
- Get instant observability. Check out New Relic I/O for more quickstarts that bundle everything you need to start monitoring your tools and technologies like a pro.
Las opiniones expresadas en este blog son las del autor y no reflejan necesariamente las opiniones de New Relic. Todas las soluciones ofrecidas por el autor son específicas del entorno y no forman parte de las soluciones comerciales o el soporte ofrecido por New Relic. Únase a nosotros exclusivamente en Explorers Hub ( discus.newrelic.com ) para preguntas y asistencia relacionada con esta publicación de blog. Este blog puede contener enlaces a contenido de sitios de terceros. Al proporcionar dichos enlaces, New Relic no adopta, garantiza, aprueba ni respalda la información, las vistas o los productos disponibles en dichos sitios.


