The rate of change within your software is faster than ever, and with this pace comes the risk that your team may miss issues, or lose critical time trying to diagnose the causes of errors.
Proactive Detection, an essential part of our recently released AIOps solution, New Relic AI, helps DevOps teams avoid such problems and drive faster mean time to resolution (MTTR) by proactively detecting and analyzing anomalies using data from New Relic APM.
Whether it’s alerts you didn’t know you needed to set up or dependent systems you may not even own, New Relic AI Proactive Detection surfaces and analyzes anomalies, bringing attention to potential problems before they become bigger issues—all within your team’s existing incident response workflows.
Easy to set up, Proactive Detection simply needs a configuration name and a list of the applications to be monitored to begin discovering and analyzing anomalies in your system.
Today we’re announcing four key enhancements to Proactive Detection:
- An in-depth analysis of each anomaly via the Analysis page
- A complete list of all anomalies in your environment with the Anomaly overview
- Integration with the New Relic Database (NRDB), so you can create dashboards and alerts based on anomaly data
- Integration with New Relic AI Incident Intelligence—via NRQL alerts—for deeper context into incidents
Automatic analysis of every anomaly
Not only does Proactive Detection flag and notify you of anomalies in your system, it also analyzes each anomaly to help you speed troubleshooting.
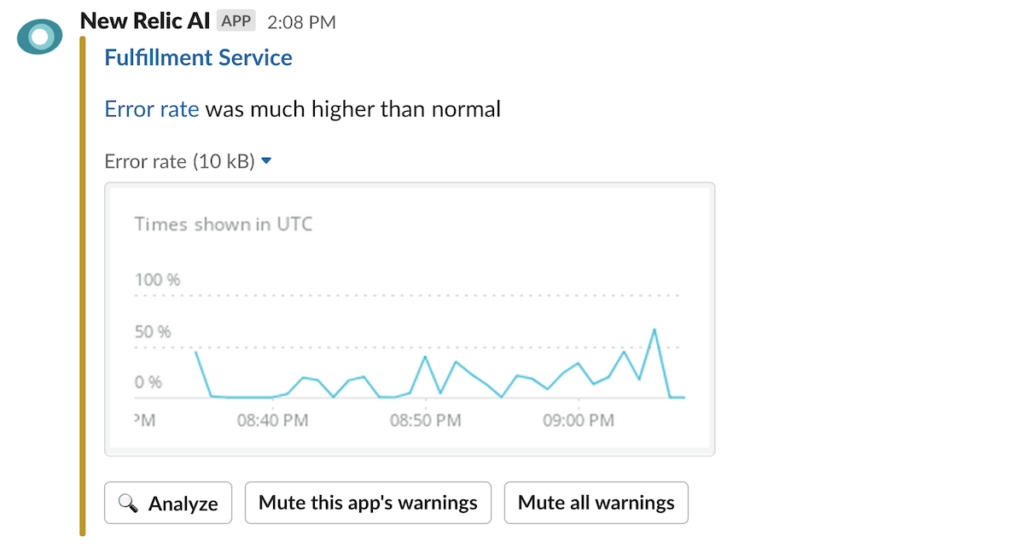
The Analyze page automatically surfaces queries and context to help explain the cause of an anomaly. Each Proactive Detection notification delivered in Slack provides a link to the Analyze page, allowing you to easily investigate an anomaly or switch between anomalies as you dive deeper into issues.
The Analyze page provides an overview of the anomaly itself, as well as details and recent activity for an entity. When available, Proactive Detection automatically suggests attributes that help explain the cause of the anomaly and provide paths for further troubleshooting, as shown in the Key Attributes section:
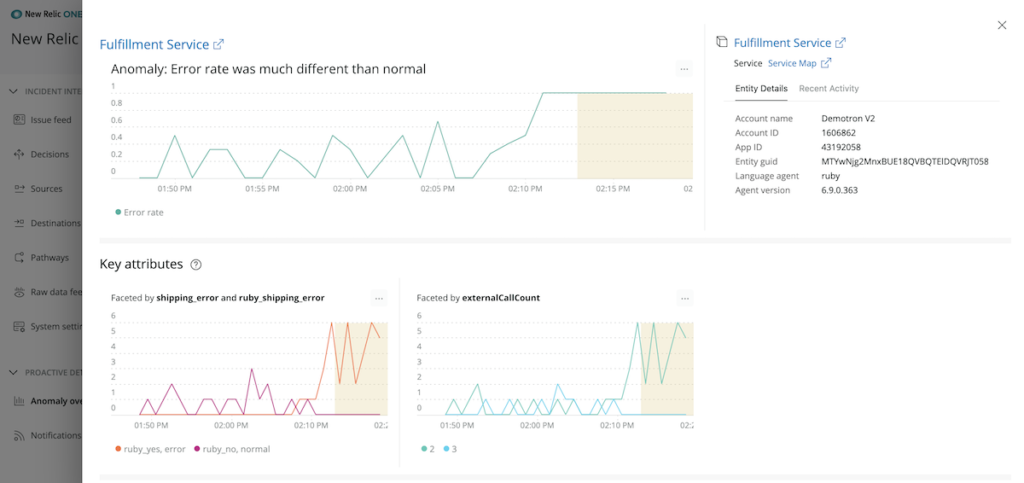
Proactive Detection uses APM event data to suggest queries that explain the anomaly, based either on statistical differences in the data or on historical usage.
Finally, the Analyze page provides a table with sparklines that include anomalies related to the SRE “golden signals” (error rate, throughput, and response time) for the affected entity, and lists additional anomalies in related applications that are upstream or downstream of the initial anomaly.
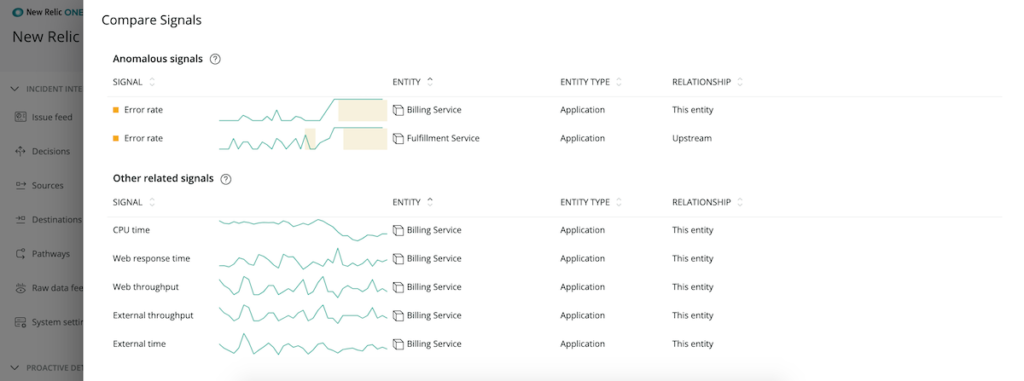
All of this gives your team a holistic view of the events leading up to the anomaly, helping you better identify what is happening in your application and environment.
See all anomalies in a single view
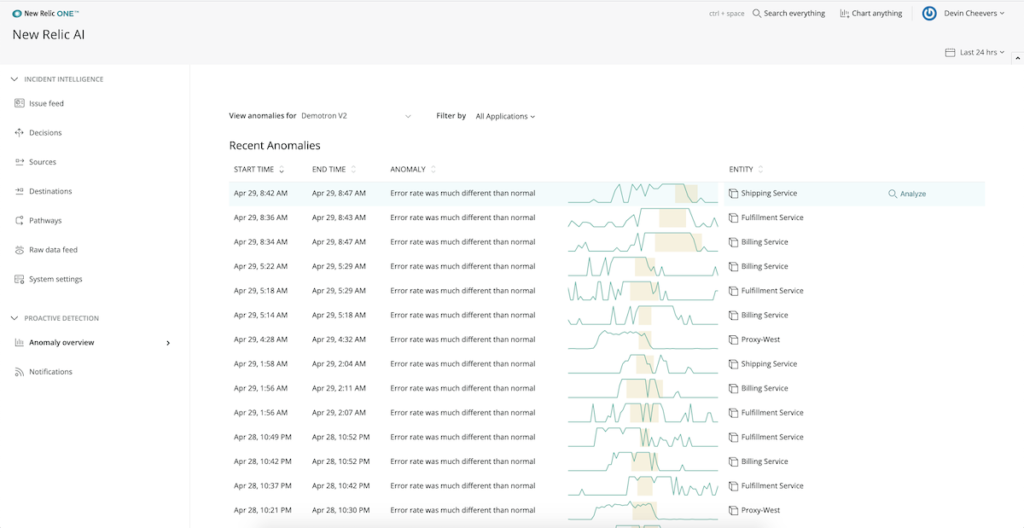
The Analyze page provides the context surrounding one anomaly, but the Anomaly overview page gives you a broader view of what's happening in your environment. You’ll have a full view of all detected anomalies, with the ability to instantly view more details for each one.
If you want to dive in and learn even more about a specific anomaly, simply use the Analyze link.
Alert, query, and leverage the power of anomalies in NRDB
Since all anomalies are automatically written to the NRDB, you can use anomaly data to build dashboards, or create alerts.
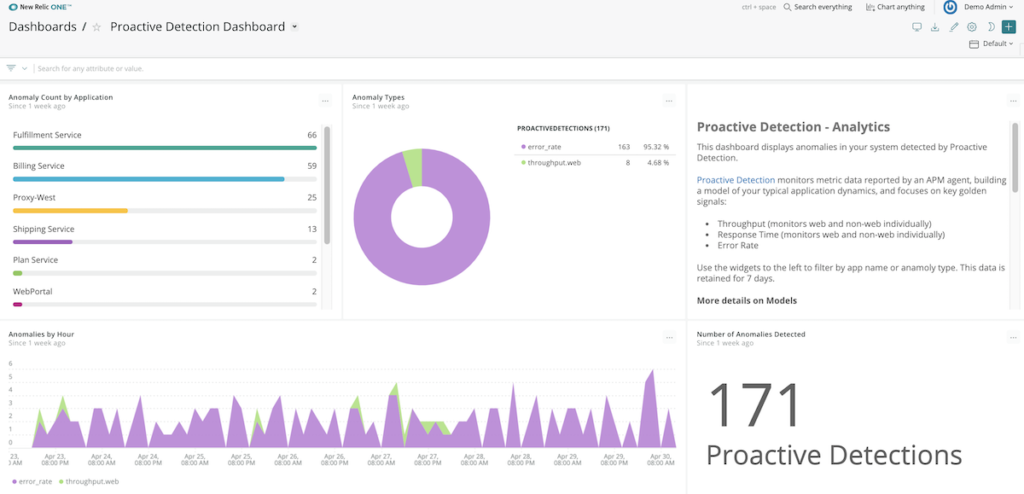
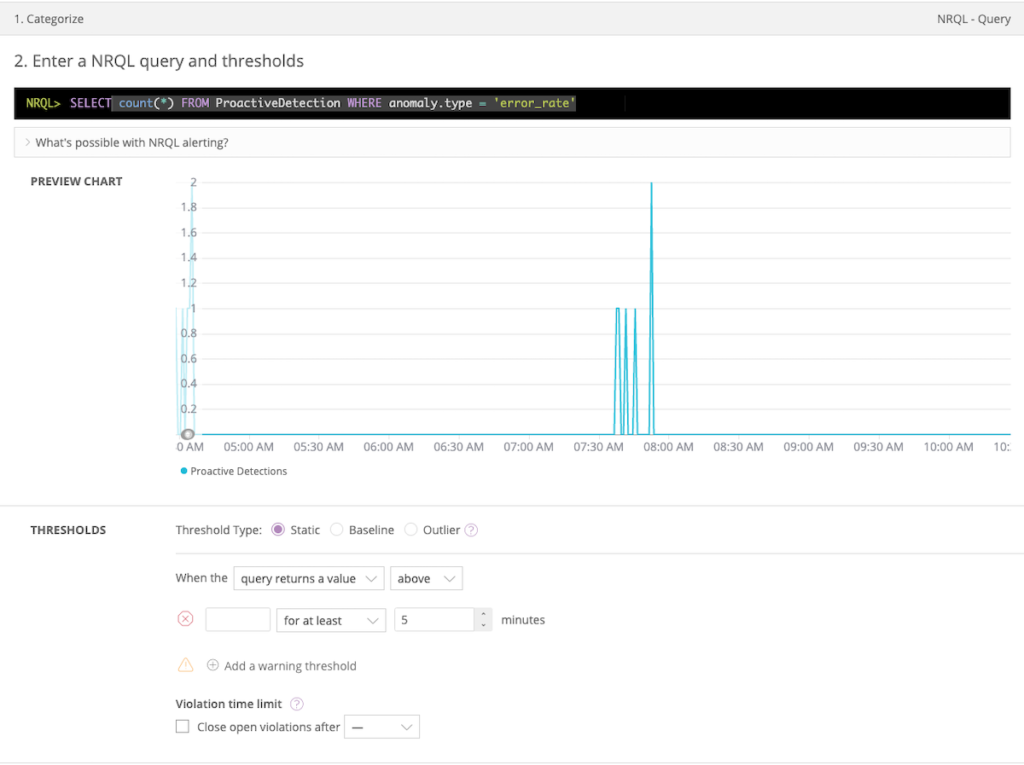
For example, use Proactive Detection data in NRQL alerts to notify you when clusters of anomalies occur. Any anomaly can be plotted in a dashboard to discover trends and patterns. You can even build your dashboards to show anomalous events that are relevant to the specific applications you’re monitoring for anomalies in Proactive Detection.
The full power of New Relic AI: anomalies integrated into Incident Intelligence
Proactive Detection and Incident Intelligence are New Relic AI’s critical set of capabilities that help teams detect issues early, eliminate alert noise, and drive toward even faster MTTR.
Incident Intelligence uses AI and machine learning (ML) to suppress alerts you don’t care about and correlate related incidents and events into single issues, without excessive configuration, training, or onboarding.
Stronger together, you can now link anomalies detected with Proactive Detection to Incident Intelligence—via NRQL alerts—to receive enhanced context inside of your Incident Intelligence to gain the full power of New Relic AI.
New Relic AI Proactive Detection has a free tier that you can start using today:
- If you’re new to New Relic, sign up for your free account.
- Already using New Relic? Get started with Proactive Detection in under 10 minutes by visiting http://one.newrelic.com > New Relic AI > Proactive Detection.
Interested in learning more about New Relic AI, check out these resources:
- Accelerate Incident Response with AIOps: An introduction to AIOps best practices with New Relic AI (eBook)
- Accelerate Incident Response with AIOps (Webinar)
- New Relic AI documentation
- Request a demo
As opiniões expressas neste blog são de responsabilidade do autor e não refletem necessariamente as opiniões da New Relic. Todas as soluções oferecidas pelo autor são específicas do ambiente e não fazem parte das soluções comerciais ou do suporte oferecido pela New Relic. Junte-se a nós exclusivamente no Explorers Hub ( discuss.newrelic.com ) para perguntas e suporte relacionados a esta postagem do blog. Este blog pode conter links para conteúdo de sites de terceiros. Ao fornecer esses links, a New Relic não adota, garante, aprova ou endossa as informações, visualizações ou produtos disponíveis em tais sites.


