Like many modern software organizations, New Relic engineering teams embrace DevOps, and we've found New Relic a powerful tool to help teams plan for peak demand. Part of any DevOps practice includes enhancing how systems work by developing techniques for reducing toil and automating manual tasks, which is commonly referred to as reliability. But how specifically do teams at New Relic use our own platform to enhance our DevOps and reliability practices?
Our engineering teams around the world work on multiple codebases that interact with each other in extremely complicated ways. The architecture of the New Relic platform uses technology like microservices and containers; these add layers of abstraction between the code we write, and where and how that code executes. The more complex our system gets, the more challenging it becomes to make changes safely, efficiently, and reliably. Fortunately, as DevOps practitioners, we’ve found a number of ways to leverage New Relic to increase the reliability and availability of our products.
Here are a half dozen examples of how the New Relic Alerts team uses New Relic to achieve these goals.
Don’t miss: The New Relic Guide to Measuring DevOps Success
1. Reliability through capacity monitoring
Few would deny that effective capacity planning can be a struggle. It’s often a manual process that requires teams to analyze a bunch of data and project growth into the future. On the Alerts team, we’ve automated part of our capacity planning process by leveraging the Alerts platform.
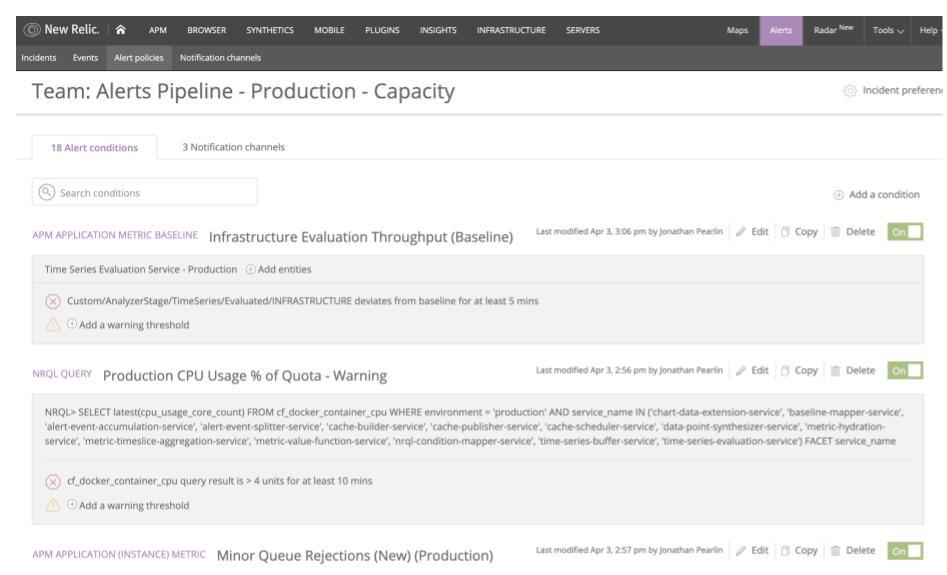
To do this, we created Alert conditions that monitor custom metrics and events about capacity emitted by our services alongside other metrics and events, such as CPU usage and queue rejections, produced by New Relic’s container orchestration platform, which manages all our containerized services.

These conditions watch for increases in resource use that may require us to scale our capacity. More importantly, this approach gives us low-priority notification channels through which we can detect scaling issues long before they become critical. We’re also able to reduce the time we spend as a team reviewing our capacity.
2. Reliability through SLA monitoring
In addition to capacity planning, we’re also responsible for maintaining the quality and availability of the Alerts service to meet our customers’ expectations, specifically through service level agreements (SLAs). And like capacity monitoring, setting an SLA can be a time-consuming endeavor.
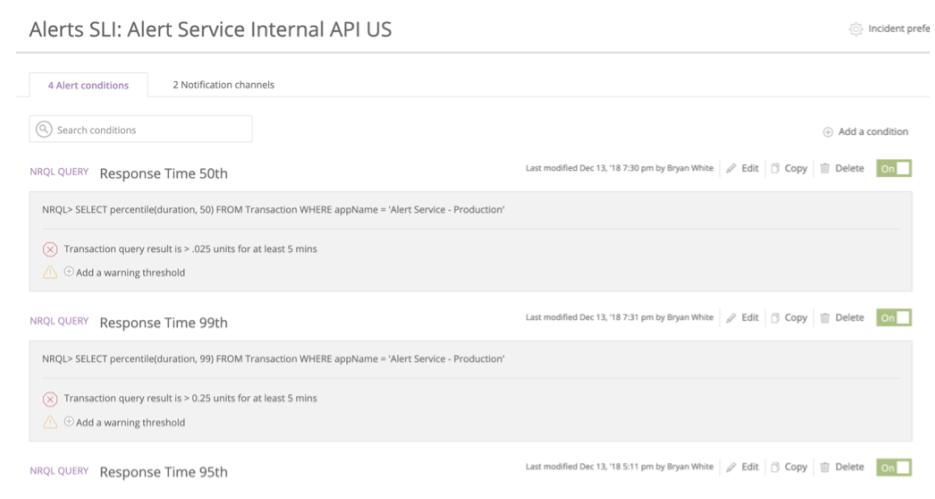
On the Alerts team, we calculate our SLA by recording key indicators throughout our system in the form of custom metrics and events. More specifically, our SLA is based on notification latency, which is the amount of time it takes New Relic Alerts to generate a notification after it receives data for evaluation.
We monitor our SLA so we can be notified when there is an SLA miss, and we also have an SLA dashboard that we share with our team, the support team, and others throughout the organization who are interested in our current status. By reducing the amount of manual work required to calculate the SLA, we free up time to focus on feature development and reliability work while remaining confident that we’re providing the level of service our users expect.
3. Reliability through SLI monitoring
It’s great when DevOps teams can create their own SLA conditions, but it’s even better when they can work together across the full engineering organization to establish service level indicators (SLIs) for an entire platform. SLIs are the key measurements of the availability of a system, and as such, they exist to help engineering teams make better decisions. To solve the problem of decentralized and manually entered SLI information across our engineering teams, the New Relic reliability team created an API system called Galileo. Built on top of New Relic Alerts, Galileo detects violations of key system health indicators across all of New Relic, and it sends violations as Alerts incident notification webhooks to an internal database. The end result? A central repository of system health statuses generated automatically by a system built on top of the New Relic platform.

4. Reliability through data health
“Why didn’t my Alert condition violate and notify me?”
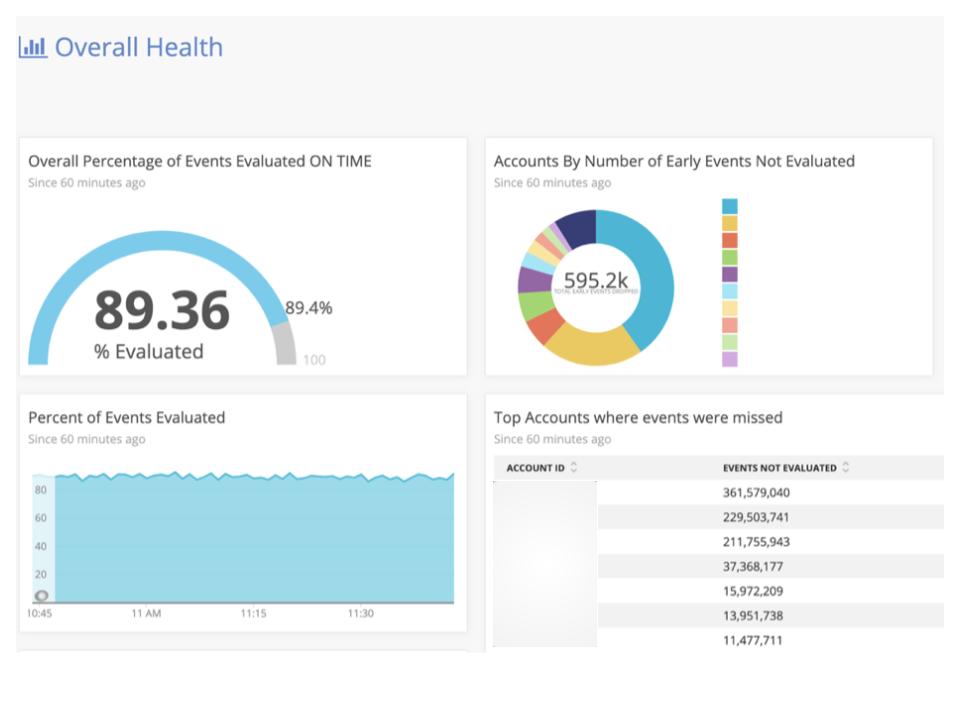
This is a support ticket the Alerts team never wants to see. Typically, these tickets referenced conditions our customers configured through New Relic Query Language (NRQL) conditions. We saw enough of these tickets over time that we used New Relic Insights to create a data app (a collection of linked dashboards), which we could use as a support tool to figure out what was happening. Our data app combined metadata provided on the NRQL query results with internal evaluation data gathered from the Alerts pipeline into one Insights event, and gave us the ability to track the fidelity of our data stream.
The Alerts team uses data apps to get a holistic view of its data stream. (Image altered for privacy.)
More specifically, we were able to use the data app to determine if the Alerts stream was missing data or if the support ticket truly needed more investigation, saving our team a lot of troubleshooting time.
5. Reliability through “dark data”
Rolling out a new feature can be time consuming, especially when teams need to mitigate post-release issues and maintain reliability levels. To address these issues, the Alerts team has been using the idea of “dark data”: a play on the concept of “dark matter,” in which data exists in the system but can’t be directly observed by the user. We gather “dark data” about a feature by running new logic or data flows side by side with existing logic in order to gain confidence that a new feature is functional and that we have properly scaled our infrastructure to support it.
Using a combination of feature flags and custom events, we record what would happen if the new code path went live, and we visualize that data in dashboards, so we can compare the new code’s performance against what already exists. This is real data we use to inform risk reduction and estimation accuracy in our rollout decisions.
6. Reliability through gameday testing
The Alerts team periodically performs gameday tests to help ensure that everything works as expected when we introduce chaos into the system—a DevOps best practice. Our gamedays require that we have alert conditions in place before starting, as our goal is to verify that the alert conditions we’ve set really will notify us if an outage occurs.
Manually creating alert conditions can be tedious, though, so we use labels to group applications together for alerting purposes. We can then create alert conditions that target the label instead of individual services, which works particularly well for services with similar behavior and thresholds. By separating services into different alert policies, we’re able to test alert conditions in a gameday setting without accidentally paging an on-call engineer. Using labels also makes it easier to move services between alert policies, we simply change labels as needed. By reducing gameday preparation time, we can spend more time on improving the reliability of our system.
Accelerate your DevOps velocity
Time spent performing mundane and repetitive tasks is time not spent on our mission of creating a more perfect internet. Finding ways to improve our DevOps efficiency is critical to our success. Luckily, we have an amazing resource at our disposal: the New Relic platform.
As opiniões expressas neste blog são de responsabilidade do autor e não refletem necessariamente as opiniões da New Relic. Todas as soluções oferecidas pelo autor são específicas do ambiente e não fazem parte das soluções comerciais ou do suporte oferecido pela New Relic. Junte-se a nós exclusivamente no Explorers Hub ( discuss.newrelic.com ) para perguntas e suporte relacionados a esta postagem do blog. Este blog pode conter links para conteúdo de sites de terceiros. Ao fornecer esses links, a New Relic não adota, garante, aprova ou endossa as informações, visualizações ou produtos disponíveis em tais sites.


