At the heart of business innovation is software—and the teams who create it, deploy it, and operate it. But software is getting much more complex. To keep innovating, software teams embrace observability because it affords them speed, understanding of overall performance, and confidence that changes aren’t going to bring down the system. Not just observability into certain parts of their environment, but observability across the full estate—from the end-user experience to backend databases and every component in between.
Last year, to help software teams tackle this complexity, we introduced a radical simplification to our New Relic One platform with a single goal: dramatically simplify and reduce the total cost of instrumenting and measuring “all the things.” This consolidation brought together all our existing products and capabilities into a single integrated product within New Relic One called Full-Stack Observability.
Visualize and explore your data like never before
With our recent announcement, we’re building on this innovation with New Relic Explorer, an experience we created as the essential daily view that will help you and your software teams understand what’s happening across your entire environment—applications, infrastructure, logs, browser, mobile—all of it. As part of Full-Stack Observability, New Relic Explorer gives you unprecedented, instant visibility into the end-to-end estate.
An intuitive experience for visualizing and exploring all your telemetry data, New Relic Explorer has it all in one place, including open source and third-party data, with zero configuration. You can discover emerging issues in real time, without relying on static, pre-configured thresholds or dashboards, because crucial changes in your estate are highlighted across all your accounts. The result is instant understanding, at a glance, of changes and health across your entire environment so you can zoom in to analyze, understand, and resolve issues faster.
New Relic Explorer includes several new approaches to visualizing, exploring, and understanding your entire estate:
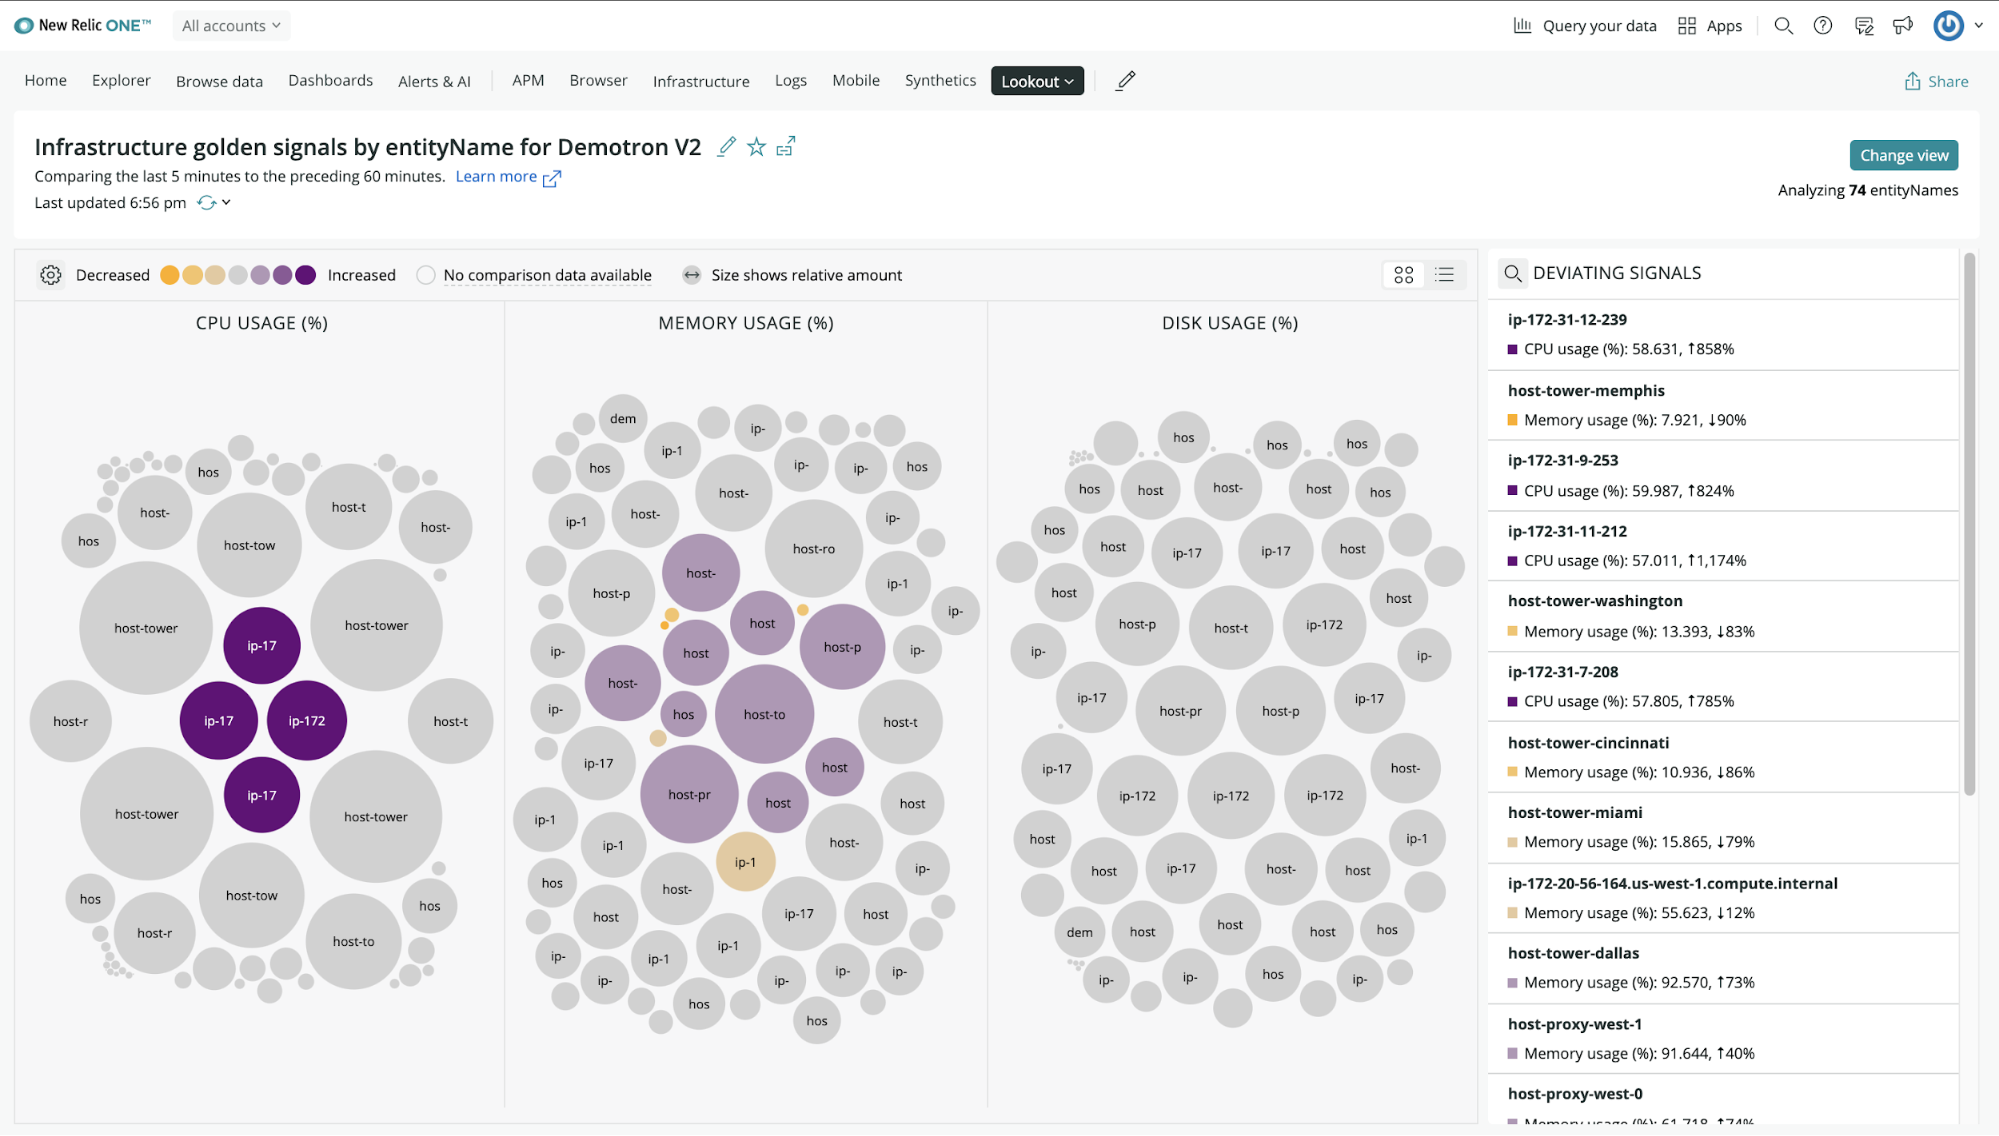
New Relic Lookout provides a real-time view across all your accounts, highlighting changes in all your telemetry, regardless of instrumentation source—even third-party and open source data—in an easy-to-understand, accessible user experience that requires no configuration. An intuitive circle visualization, with color indicating severity of recent changes and size conveying the scale, draws your attention where it’s needed most.

Beyond showing key metrics of throughput, response time, and errors, you can view changes in any signal in your telemetry data that you find important, across all your accounts. You can analyze changes with performance, abnormal history, correlations, traces, and error profiles to quickly uncover blind spots and unknown relationships so you understand what’s changed and why. That way, you can resolve issues before they impact your customers.
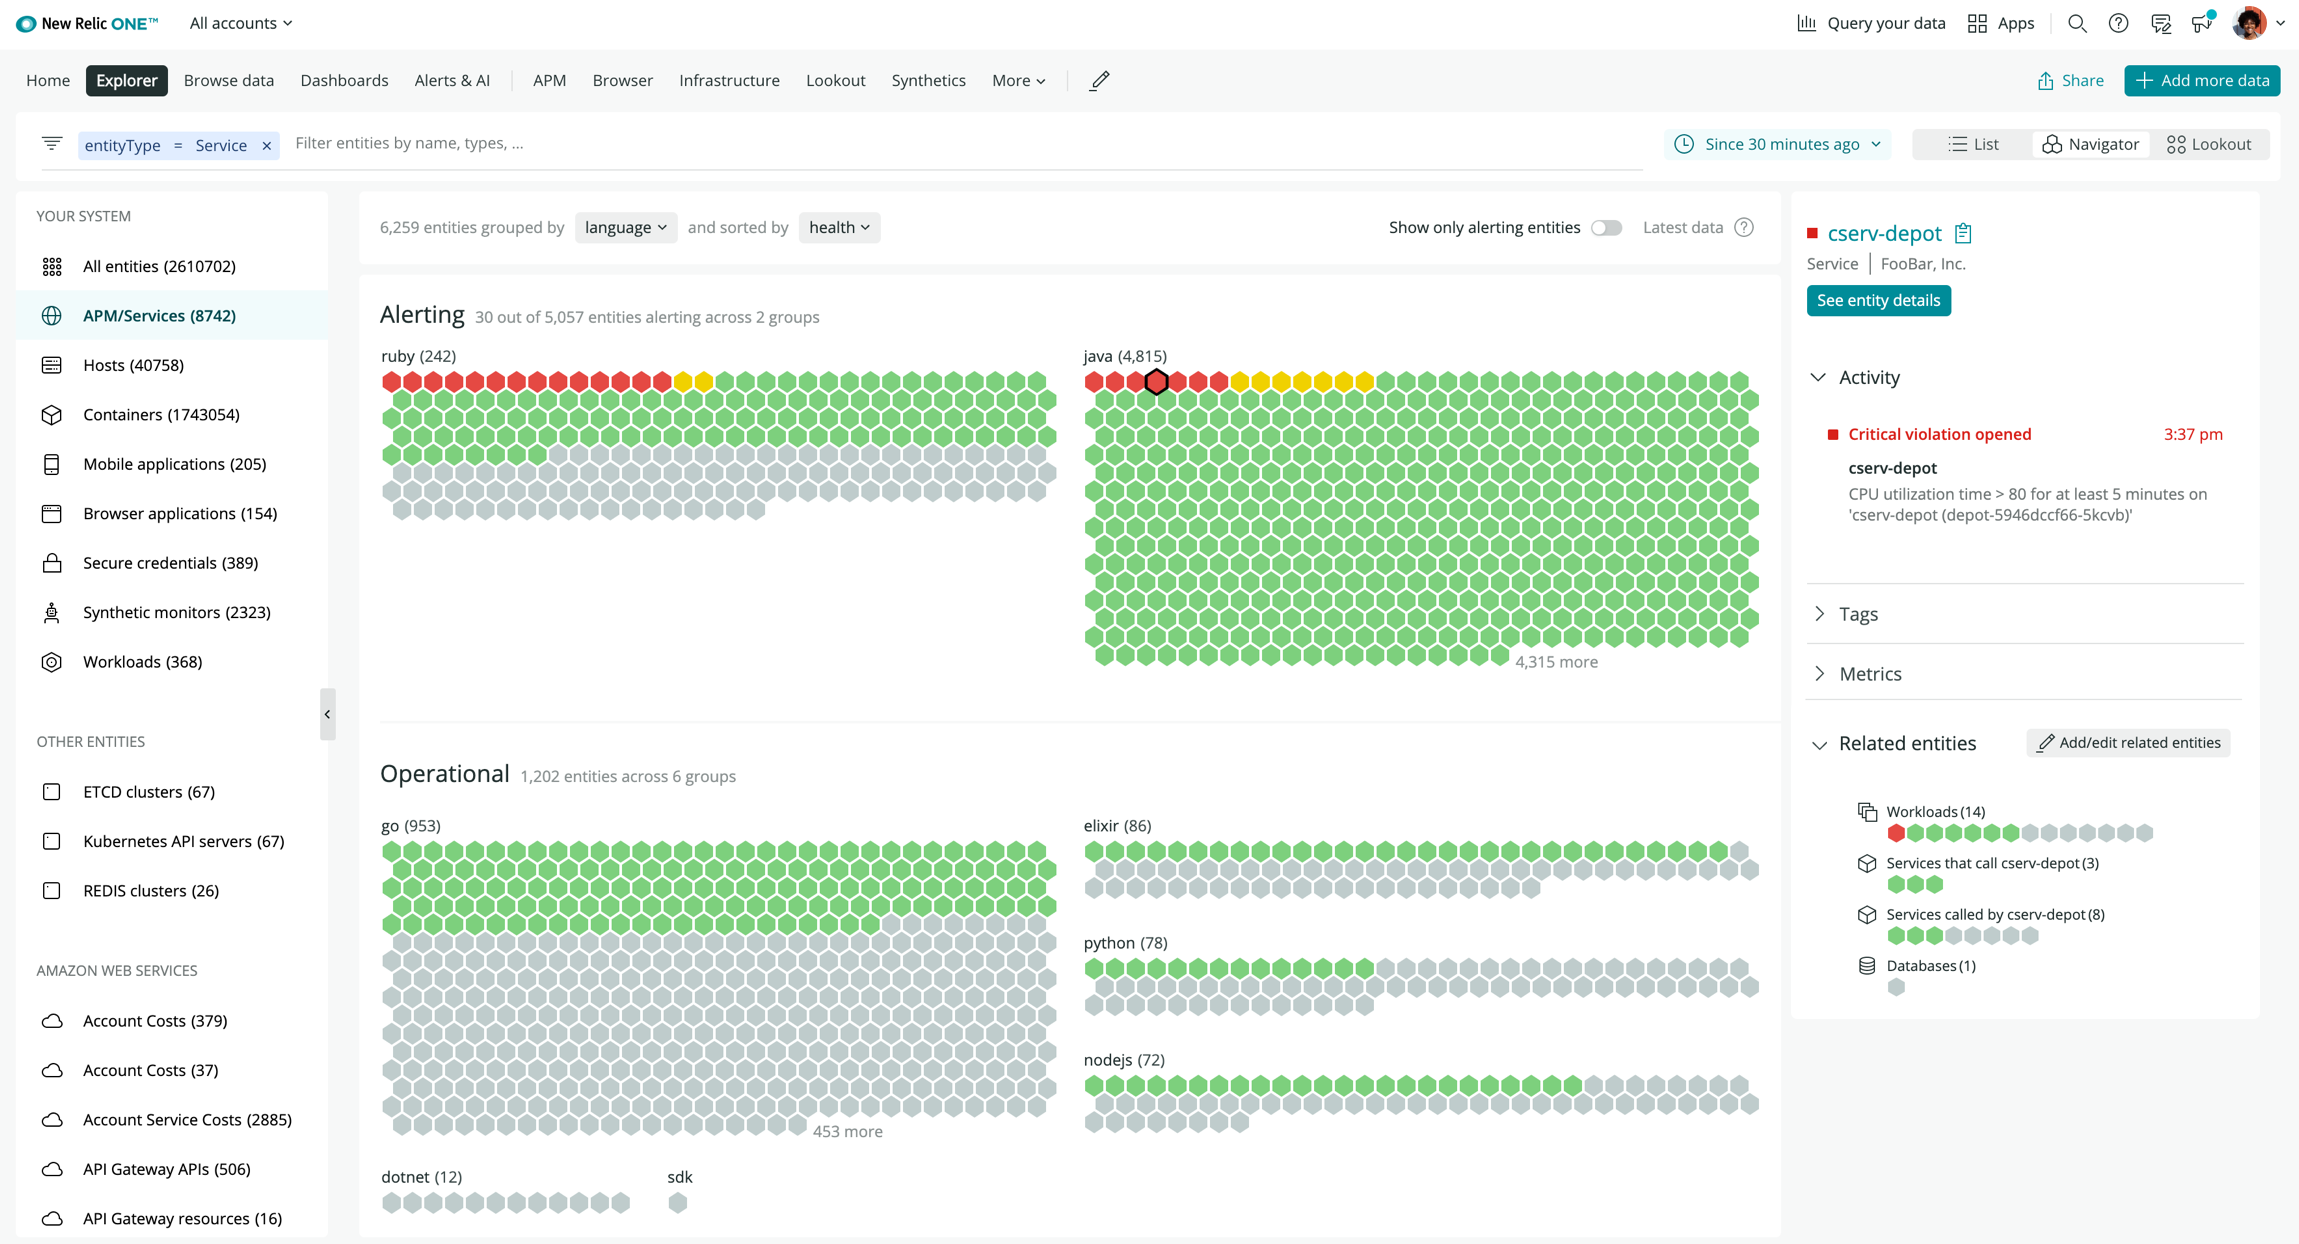
New Relic Navigator also offers an estate-wide view of your system, except it filters the view by entities rather than changes, and it displays the health of your estate in a highly dense honeycomb view with traffic-light colors based on alerts so you can quickly explore your entire environment, understand health status, and resolve issues quickly.

New Relic Navigator lets you explore all your entities belonging to all your accounts, focusing on specific entity types or specific groups of entities organized by tags to quickly zero in on issues. When you have thousands, or tens of thousands of hosts, containers, and services, this capability makes it easy for you to explore everything in one place.
Related Entities shows you all the entities related to a specific application, host, container, or integration. It lets you quickly understand which upstream or downstream services are related to an issue, gives you a broader view of the overall health of your system, and helps you troubleshoot issues faster.
How do I get all the new stuff?
All Full-Stack Observability customers have access to New Relic Explorer, including New Relic Navigator and the New Relic Lookout view. Full-Stack Observability Pro and Enterprise customers have access to New Relic Lookout, offering the full suite of analysis features and capabilities.
Our mission is to help you create more perfect software, experiences, and businesses. We are confident that these capabilities provide a major step forward in empowering you to do just that.
But don’t take our word for it—experience the simplicity of New Relic One yourself by signing up for a forever free account, and check out New Relic Explorer.
이 블로그에 표현된 견해는 저자의 견해이며 반드시 New Relic의 견해를 반영하는 것은 아닙니다. 저자가 제공하는 모든 솔루션은 환경에 따라 다르며 New Relic에서 제공하는 상용 솔루션이나 지원의 일부가 아닙니다. 이 블로그 게시물과 관련된 질문 및 지원이 필요한 경우 Explorers Hub(discuss.newrelic.com)에서만 참여하십시오. 이 블로그에는 타사 사이트의 콘텐츠에 대한 링크가 포함될 수 있습니다. 이러한 링크를 제공함으로써 New Relic은 해당 사이트에서 사용할 수 있는 정보, 보기 또는 제품을 채택, 보증, 승인 또는 보증하지 않습니다.


