The New Relic browser agent enables you to oversee the efficiency, issues, and user interaction of your web application or site. It captures information on webpage loading duration, Ajax requests, JavaScript errors, and personalized events, transmitting this data to New Relic for thorough examination and visual representation. But what if you’d like to capture the raw log data your web application emits for a more thorough debugging process? The browser agent now has a solution for this in the form of two API methods for manually capturing browser logs emitted by your web applications.
Why capture browser logs?
Capturing browser logs has a number of advantages, including:
- Help spot errors or inconsistencies that do not show up with traditional error tracking.
- Obtain verbose log messages to break down processes or transactions with finer granularity.
- Gain insight into user behaviors, responses from specific actions, or rendering issues.
- Easily organize and triage logs into manageable buckets based on level, type, page, etc..
Install and configure
If you want to use the New Relic browser agent to manually capture browser logs, you’ll need to follow some steps to install and configure it properly. Here’s a guide on how to do that.
- Open New Relic and then select Add Data from the navigation panel.
- Select Browser & Mobile, then select the Browser monitoring data source.
- Choose your deployment method, either APM or Copy/Paste.
- Select an existing app monitored in APM, or name your new app and then click Enable.
You can also utilize the browser agent NPM package to instrument your webpage. For more information about that process, see this instrumentation guide. Manually capturing browser logs is supported in browser agent versions 1.261.0 and higher.
Capturing browser logs
Manually capturing data as a single log event
If you want to capture log data on a case-by-case basis, the “log” API captures a message as a log event, while providing the flexibility to enhance the event with a specified level and custom attributes. This API has a variety of use cases, from logging one-off messages to extending your existing logging platforms.
// Capture a single log event
newrelic.log('my log message', {level: 'debug'})
// Add a logging call to your existing logging mechanisms
function yourExistingLoggerFn(message){
// capture your message
newrelic.log(message, {level: 'debug'})
// ... your other logic ...
}Capturing a single log event is as simple as calling “newrelic.log(<message>, <options>)” with a string message and an optional object specifying a logging level or custom attributes. See the API documentation for more detailed information about using this API.
Automatically capturing data passing through existing browser logging methods as log events
If you already have logging solutions incorporated into your web app and you want to capture log data every time those logging methods are invoked, the “wrapLogger” API will instrument your methods to capture a log event on every call, while still providing the flexibility to enhance the event with a specified level and custom attributes. This API allows you to capture logs across your entire application ecosystem with relatively little effort, simplifying the process either by wrapping your already-used methods or even by wrapping native browser loggers, such as console.info.
Capturing log items from the native console method(s)
newrelic.wrapLogger(console, 'info')
// from this point forward, every time `console.info` is invoked, it will save a log event
Capturing log items from a custom logger
const myLoggers = {
 logger: function(){...}
}
newrelic.wrapLogger(myLoggers, 'logger')
// from this point forward, every time `myLoggers.logger` is invoked, it will save a log event
Capturing all messages as log events is as simple as calling “newrelic.wrapLogger(<parentObject>, <functionName>, <options>)” with an object containing a method to be wrapped and an optional object specifying a logging level or custom attributes. See the API documentation for more detailed information about using this API.
Viewing browser logs
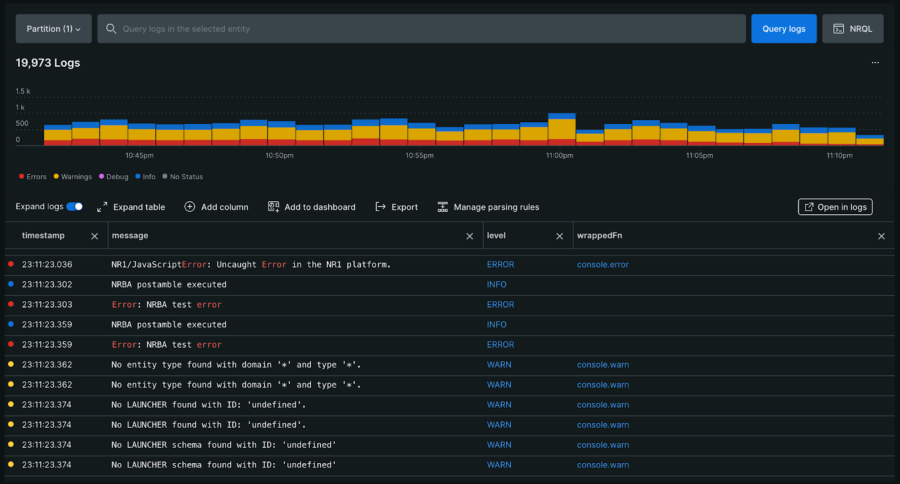
You can view, sort, and customize your captured browser logs within your browser application’s logging view. First, find your browser application, and then select “Logs” in the side panel.
Here you can customize the columns, filters, and more to help break down the issue in question. For more information on the Logging views, see the logs UI documentation.

다음 단계
By utilizing the browser agent logging APIs, you can successfully integrate your browser logs into New Relic to optimize and troubleshoot your application. Install the browser agent today to start collecting logs and improve your understanding of your application’s impact on your customer experience.
이 블로그에 표현된 견해는 저자의 견해이며 반드시 New Relic의 견해를 반영하는 것은 아닙니다. 저자가 제공하는 모든 솔루션은 환경에 따라 다르며 New Relic에서 제공하는 상용 솔루션이나 지원의 일부가 아닙니다. 이 블로그 게시물과 관련된 질문 및 지원이 필요한 경우 Explorers Hub(discuss.newrelic.com)에서만 참여하십시오. 이 블로그에는 타사 사이트의 콘텐츠에 대한 링크가 포함될 수 있습니다. 이러한 링크를 제공함으로써 New Relic은 해당 사이트에서 사용할 수 있는 정보, 보기 또는 제품을 채택, 보증, 승인 또는 보증하지 않습니다.


