Uplevel uptime with infrastructure monitoring.
Go from zero to data with 780+ quickstarts.
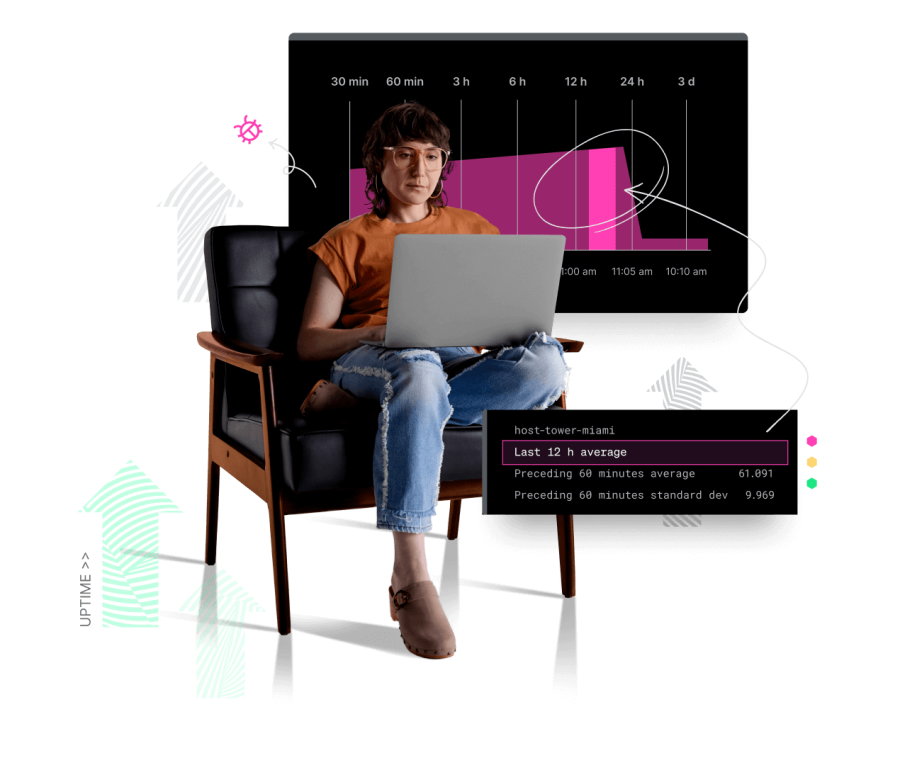
Instrument your clouds instantly. Analyze all your telemetry in one place. Observe your full stack and troubleshoot faster.


- Real, actionable insights into your stack.
- Troubleshoot infrastructure before. Not after.
- Dashboards, alerts, and integrations all in one place.
- Quickly integrate with hundreds of tools and open standards.
- Pay only for what you use—no shelfware and no overage penalties.
Powerful tools
that show powerful results.
See all your telemetry in one place.
- Optimize AWS, Azure, and GCP cloud services at scale.
- Correlate infrastructure, application, and end-user data.
- Troubleshoot faster, find the root cause sooner.
Fix issues faster with 50+ monitoring tools in one platform.
- Speed through tasks with 50+ tools in 1 connected experience.
- Detect incidents, isolate bottlenecks, and achieve resolutions.
- Understand root cause, including Kubernetes clusters and workloads.
Scale up. Keep costs under control.
- Monitor and alert on cloud usage spikes and drops.
- Compare metrics across clouds to rightsize and optimize.
- Only pay for the telemetry you use, not the shelfware you don’t.
Look who
has us open.
has us open.

