Apollo Server, an open source GraphQL server that helps you connect a GraphQL schema to an HTTP server in Node, can be used with popular frameworks such as Express, Connect, Hapi, Koa, Restify, and AWS Lambda. Developed four years ago when Facebook open sourced GraphQL, it has accelerated in popularity over REST APIs, mainly due to its efficiency. However, GraphQL can be challenging to monitor.
With GraphQL, you can fetch and retrieve data in a single query, enabling you to ask for exactly the data you need while minimizing the amount of data transferred over the network and improving performance. However, this single operation or endpoint is exactly what makes GraphQL operations challenging to monitor. Measuring the response time of one GraphQL endpoint won’t tell you enough about an application’s health. The New Relic Apollo Server plugin provides visibility into GraphQL payloads down to the resolver level and associated external service calls.
To monitor your GraphQL applications, you want to understand the timing of individual GraphQL operations and then have the ability to filter down to the root cause of an issue. If a GraphQL operation is slow, the cause of the latency could be due to several things. For one, it could be the structure of the operation itself. For example, batched operations could cause the operation to take longer than desired. Resolvers, the functions responsible for populating the data for a single field in your schema, could also cause latency. In this case, you’d want to adjust the function call.
However, latency could also be caused by an external service’s poor performance, such as an API or a database. Using distributed tracing, you can identify which external service the GraphQL field is calling and attribute the latency to that external service.
By using the New Relic Apollo Server plugin to instrument your applications, you can get to the root cause of issues. The plugin records the overall timing of the operations and then parses the payload so you can uncover and diagnose the cause of your slow GraphQL operations. Distributed tracing goes further and provides the capability to understand if the latency is coming from the application itself or other services.
Troubleshooting errors and latency
Let’s walk through two troubleshooting scenarios:
We built a simple example Node application that interfaces with NASA’s Near Earth Objects API (search for near earth object). The app allows us to monitor how close an asteroid is to Earth and when it will get here, so we have time to prepare and minimize impact. Using GraphQL, you can query NASA’s API for the asteroid’s relative velocity and distance from the Earth. It’s important that the GraphQL queries avoid errors and latency to avoid misjudging the time it will take the asteroid to reach us.
Scenario 1: Troubleshooting an error
In this first example, you see a GraphQL error on the error events page and will want to find the root cause to fix it quickly.
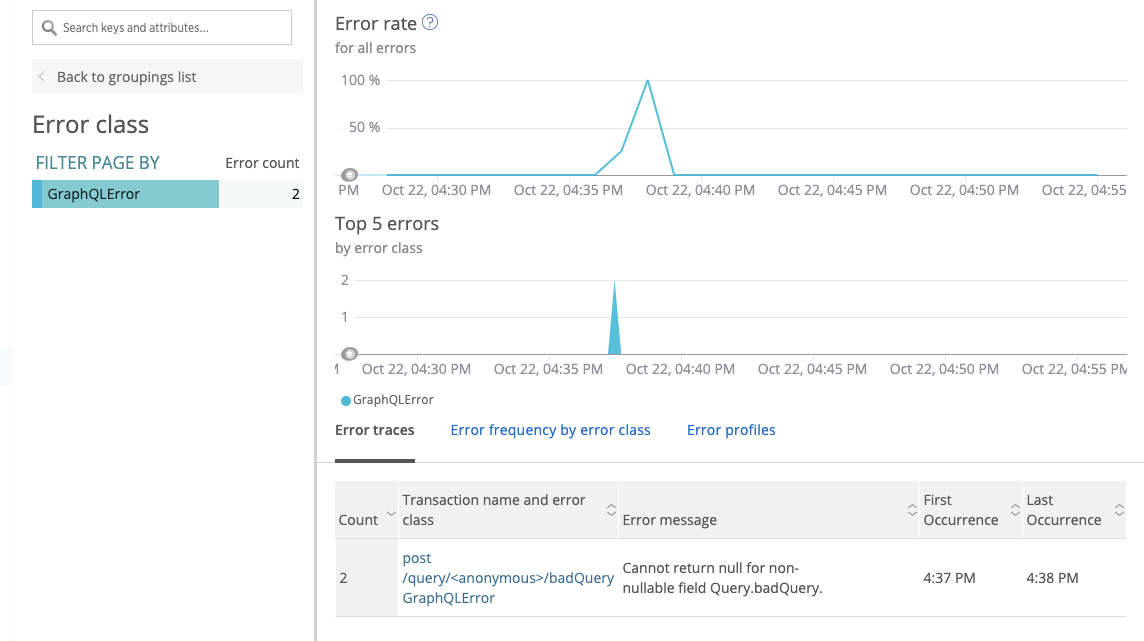
1. Click on the error class to see more detailed error information.
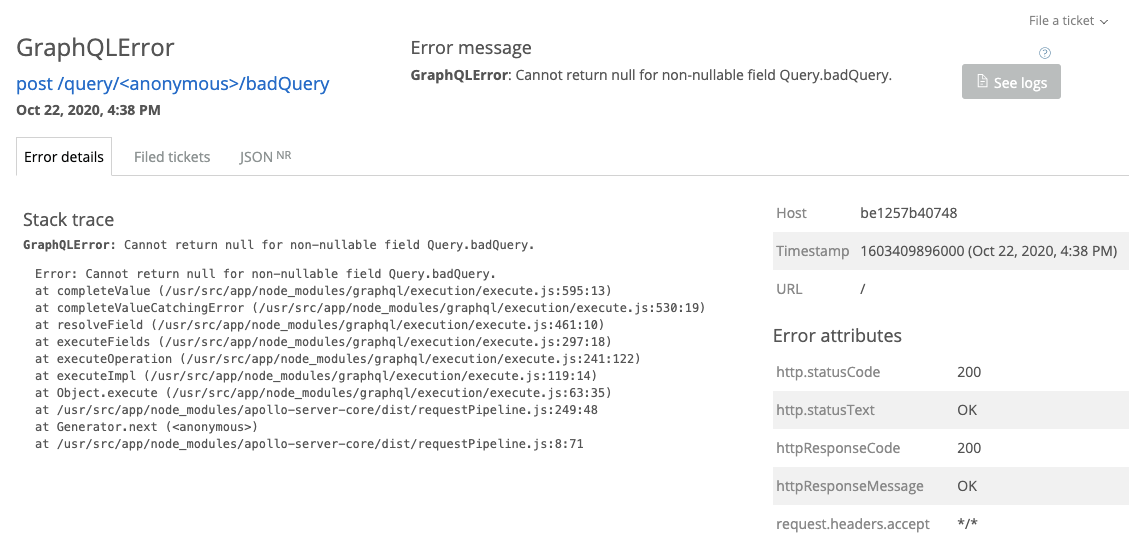
2. Select the transaction name in the transaction view, and explore it using distributed tracing.
3. In the distributed trace view, you can identify the transactions that are throwing the errors.
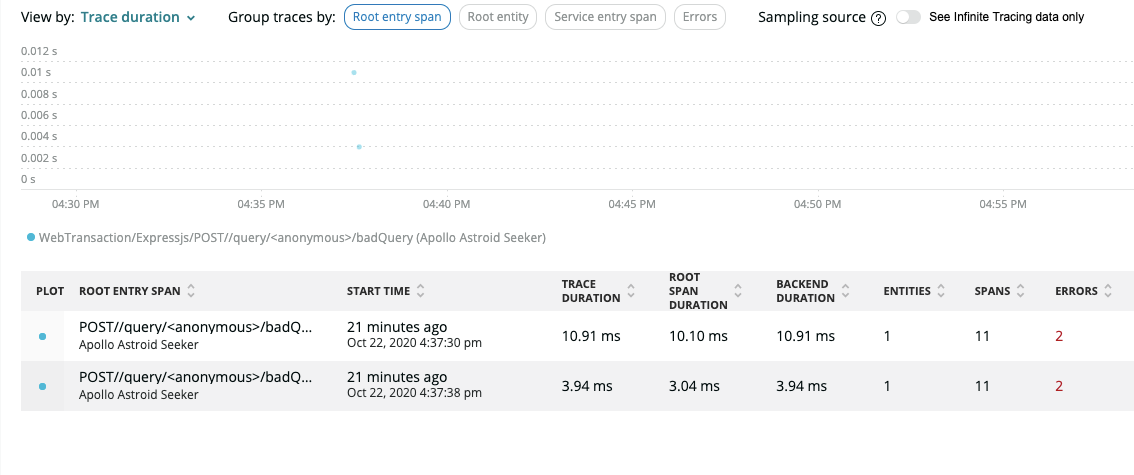
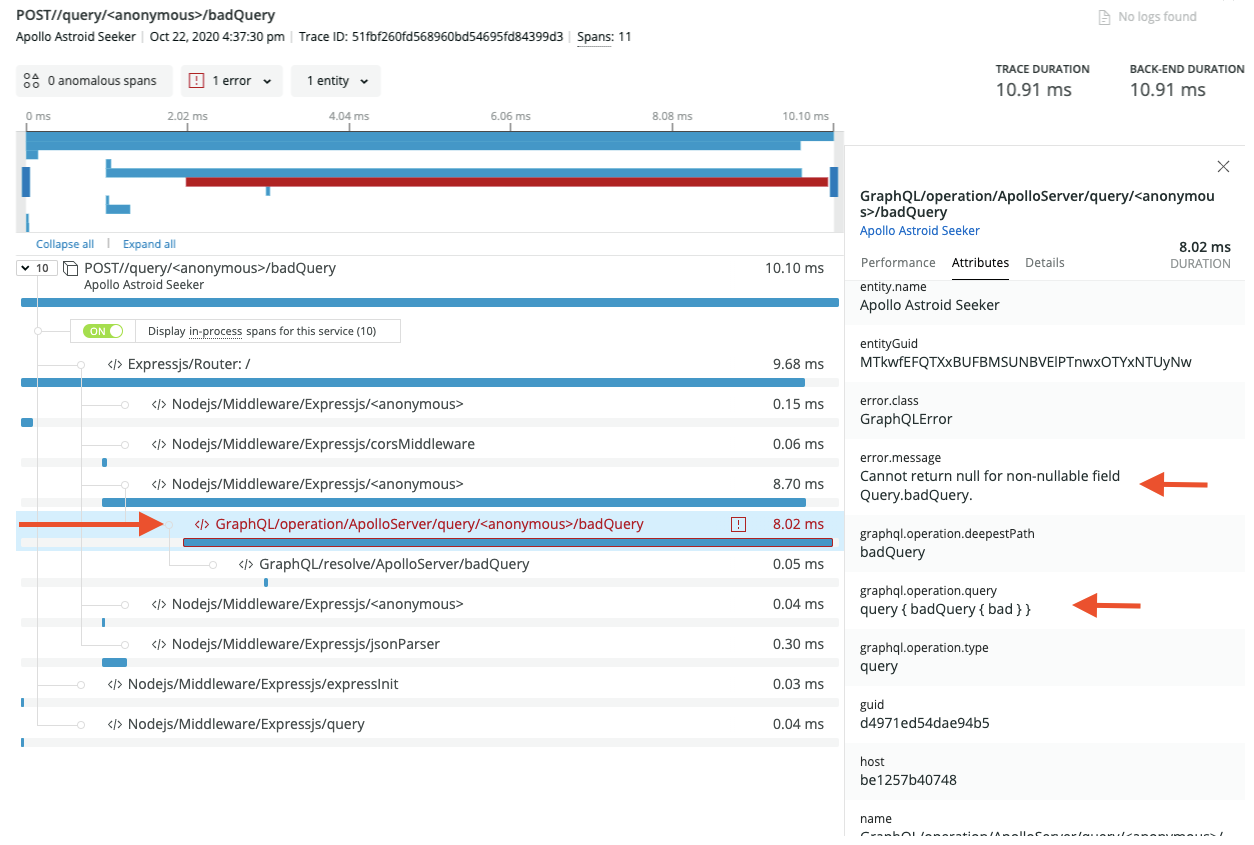
4. Click on a particular trace to get a detailed view of the operation span with the error message and the offending query. In this case, you can see an internal server error related to the resolver.
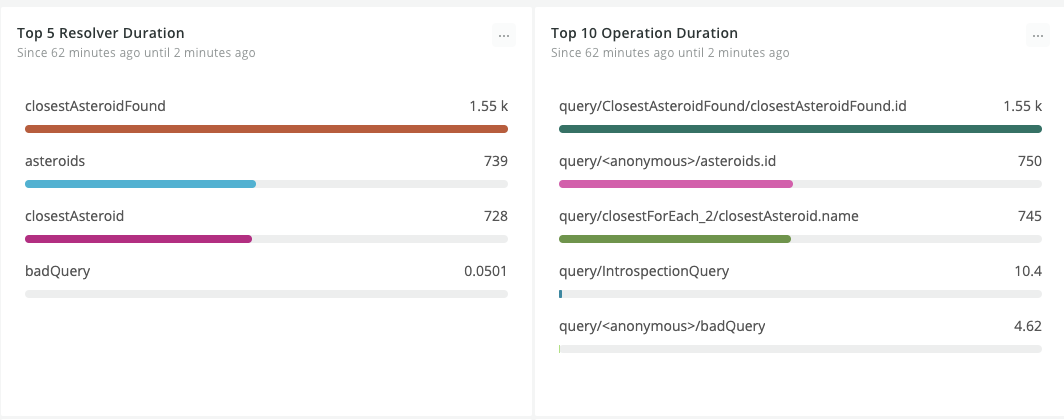
 5. Finally, you can always keep track of your slow operations and resolvers through a custom dashboard view.
Scenario 2: Latency is caused by an external service
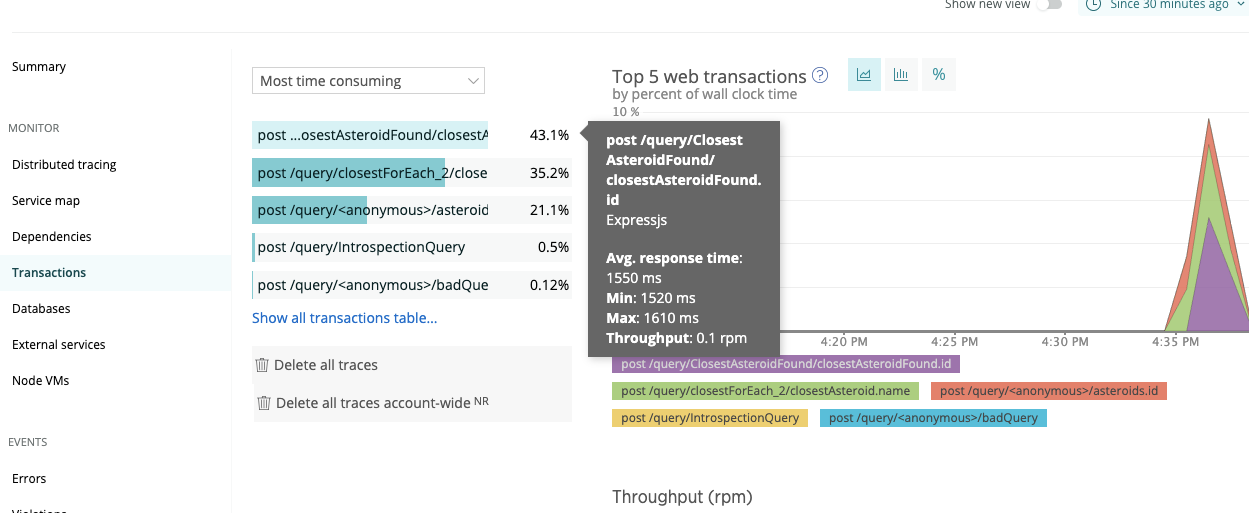
In this example, you have a transaction view that shows a slow transaction:
1. By hovering over it, you see it’s from a slow GraphQL query called ClosestAstroidFound.
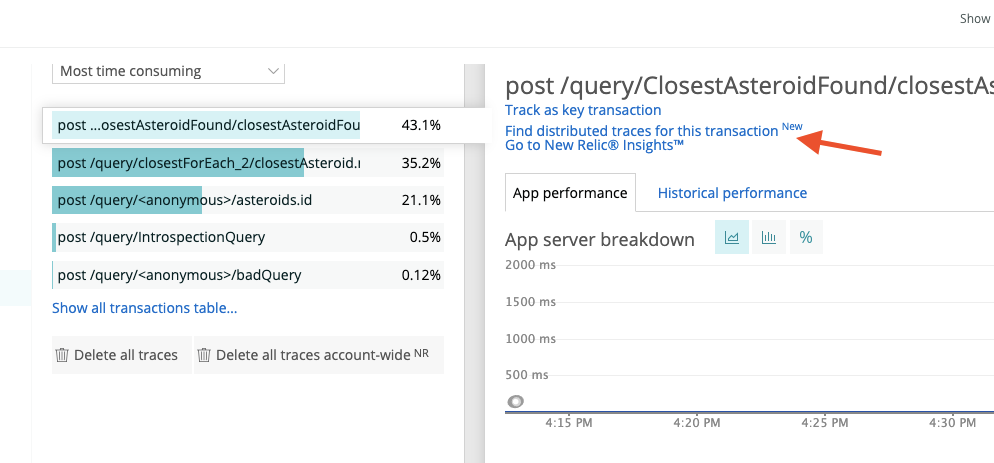
2. To understand why the query is slow, click on the transaction and select Find distributed traces for this transaction.
3. When you see slow transactions, you can explore them using distributed tracing.
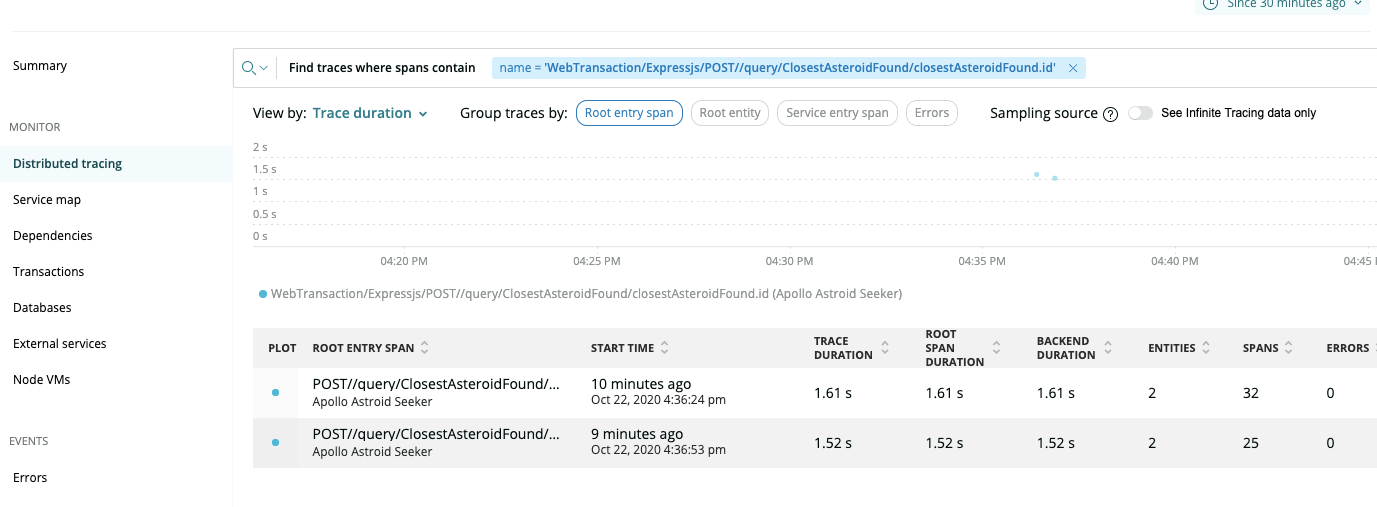
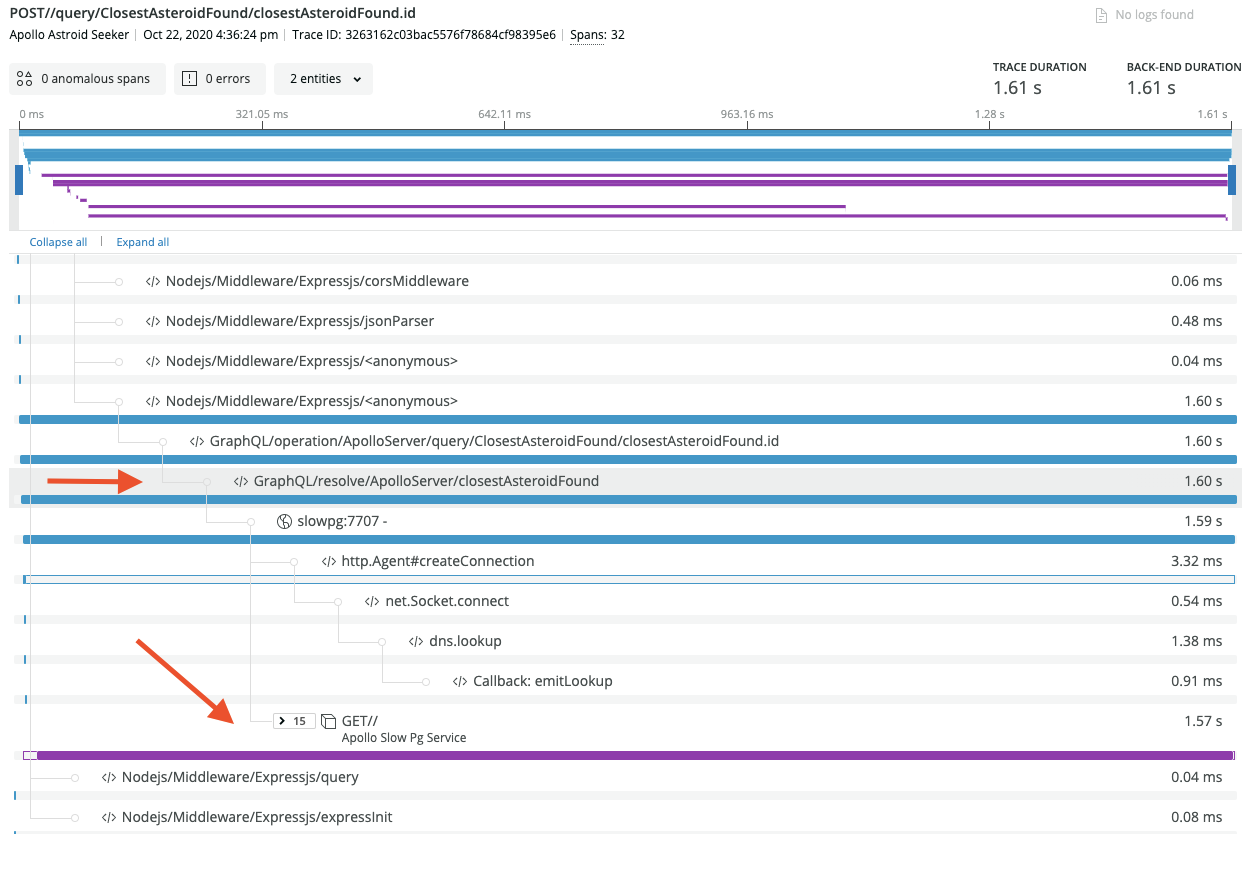
4. When exploring the transaction, expand the GraphQL resolver span and see it making a call to another instrumented service taking most of this transaction’s time.
Instrument your apps to get to the root cause of GraphQL errors and slowness in GraphQL operations with the New Relic Apollo Server plugin.
Les opinions exprimées sur ce blog sont celles de l'auteur et ne reflètent pas nécessairement celles de New Relic. Toutes les solutions proposées par l'auteur sont spécifiques à l'environnement et ne font pas partie des solutions commerciales ou du support proposés par New Relic. Veuillez nous rejoindre exclusivement sur l'Explorers Hub (discuss.newrelic.com) pour toute question et assistance concernant cet article de blog. Ce blog peut contenir des liens vers du contenu de sites tiers. En fournissant de tels liens, New Relic n'adopte, ne garantit, n'approuve ou n'approuve pas les informations, vues ou produits disponibles sur ces sites.


