As software teams modernize their applications in the cloud and ship changes more frequently with continuous delivery, they can expect to see an increase in the number of log files and the amount of log data they have to manage. Too often, though, we hear from developers, DevOps engineers, and SREs that it’s hard to maintain context when there is so much data. When troubleshooting issues arise, they don’t want to waste time—and lose context—switching between monitoring and logging tools.
New Relic Logs helps teams reduce this complexity and maintain context with their log data. With New Relic Logs, you can combine log data with application performance and infrastructure health in one place. This helps you more easily correlate log data with events and errors across your stack, troubleshoot logsand production issues faster, and reduce mean time to resolution (MTTR). New Relic Logs includes the ability to view your logs in context. By linking your log data directly to applications, APM errors, and APM traces and spans instrumented in New Relic, you can more quickly identify meaningful trends in your data.
Logs in context now available with all New Relic agents
Today, we’re expanding support for logs in context, enabling it for all New Relic APM agents, building on our existing support for Kubernetes and AWS Lambda. Now you can connect log data for all of your applications instrumented with New Relic, including those written in Go, Java, .NET, Node.js, PHP, Python, and Ruby.
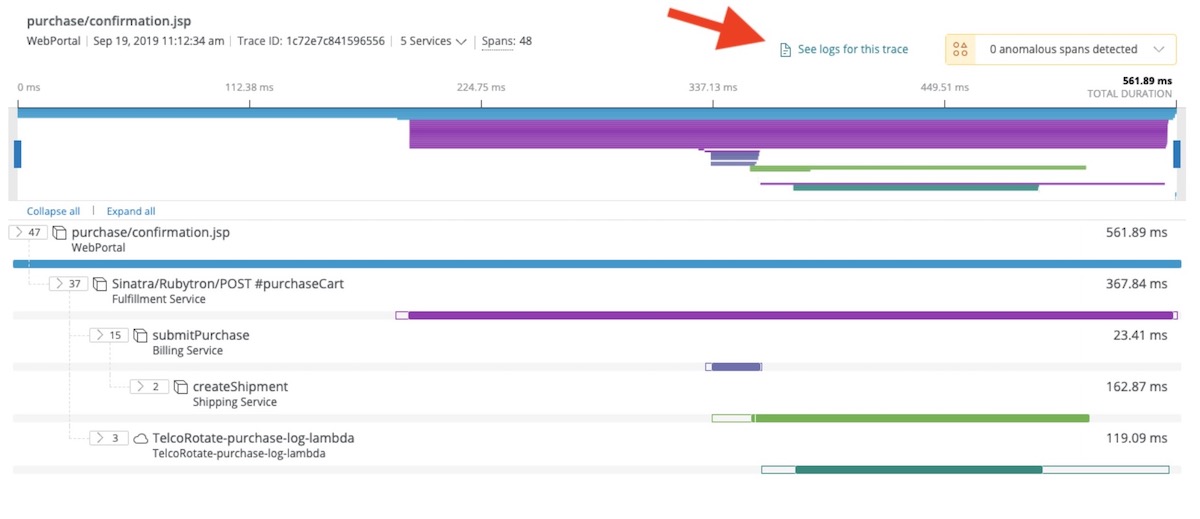
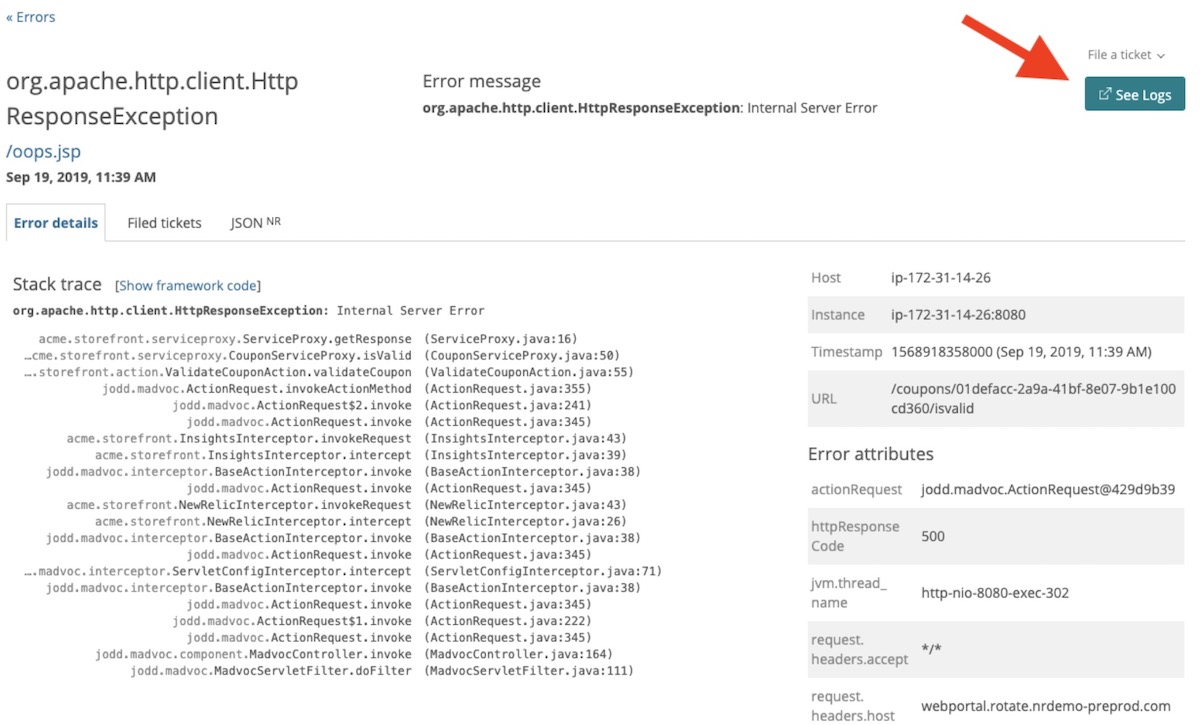
For example, you can correlate log messages to a related error trace or distributed trace for an instrumented application by appending trace IDs to the corresponding application logs, then automatically filtering to those logs from the errors or distributed trace user interfaces in New Relic.
In this example, we’re troubleshooting a problematic trace in New Relic One distributed tracing:
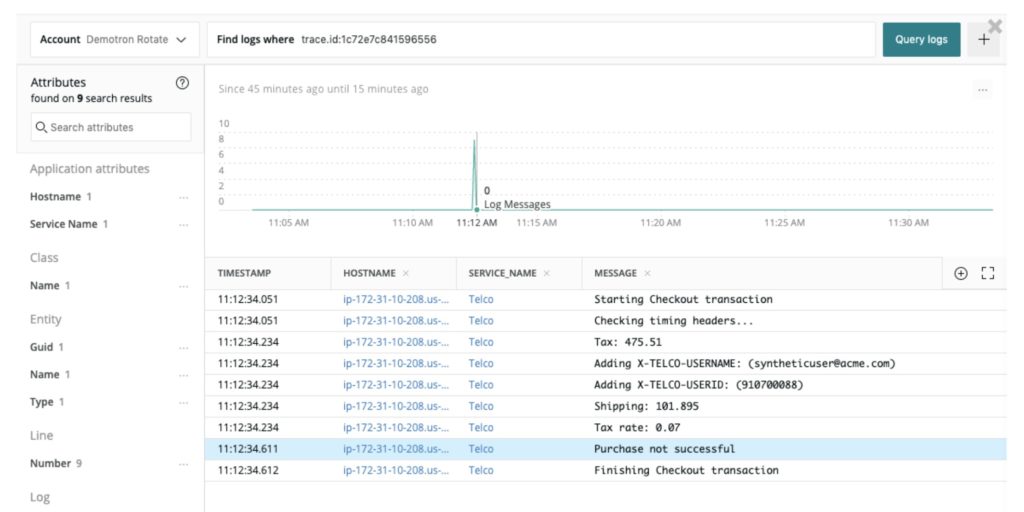
After clicking the link to the logs for that trace, the New Relic Logs UI shows us the log messages associated with that problematic trace:
By bringing all of this data together in a single tool, we want to make it easy for you to quickly get to the root cause of an issue and narrow down from all of your logs, so you can quickly find the exact log lines that you need to identify and resolve a problem.
Get started with logs in context today
New Relic Logs gives you fast, scalable log management that connects your log data with the rest of your telemetry data, including metrics, traces, and events. Pre-built plugins to some of the most common open source log forwarders (Fluent Bit, Fluentd, Amazon CloudWatch, AWS FireLens, Logstash, and more) make it simple to send your data from anywhere to New Relic. If you’re already a New Relic Pro subscriber, you can get started for free by enabling New Relic Logs and installing a compatible log forwarding plugin, or you can send log data directly to New Relic via our Log API.
See Configure logs in context with APM agents in the New Relic documentation to get started!
Once you’re up and running, explore your data within the New Relic Logs UI; troubleshoot errors with distributed tracing, stack traces, and application logs; and query your data to create custom dashboards, charts, and alerts.

As always, we love to hear your feedback. Visit the New Relic Explorer's Hub and let us know what you think!
To learn more about how logs relate to your other telemetry data, check out M.E.L.T. 101: An Introduction to the Four Essential Telemetry Data Types.
As opiniões expressas neste blog são de responsabilidade do autor e não refletem necessariamente as opiniões da New Relic. Todas as soluções oferecidas pelo autor são específicas do ambiente e não fazem parte das soluções comerciais ou do suporte oferecido pela New Relic. Junte-se a nós exclusivamente no Explorers Hub ( discuss.newrelic.com ) para perguntas e suporte relacionados a esta postagem do blog. Este blog pode conter links para conteúdo de sites de terceiros. Ao fornecer esses links, a New Relic não adota, garante, aprova ou endossa as informações, visualizações ou produtos disponíveis em tais sites.


