New Relic Insights, our platform for real-time analytics and data visualization, helps customers better understand how their applications and infrastructure are performing, the quality of the end user experience they’re delivering, and how their business is running. In the past year, the Insights team has launched a variety of cool new features such as the Metric Explorer, the Dashboard Timepicker, and company-wide dashboards, all designed to make the dashboarding and data exploration experience more cohesive, customized, and easy to navigate.
Today, we’re excited to announce a new feature that allows customers to add notes to their dashboards: Dashboard Notes!

Text and charts, together!
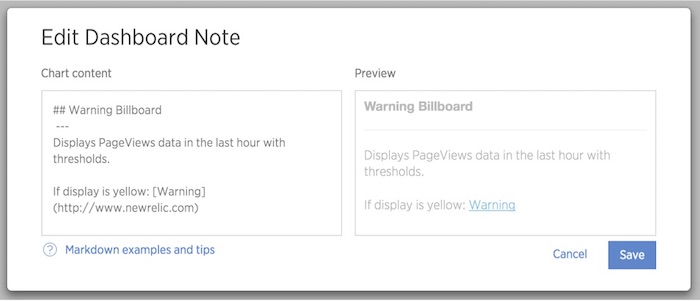
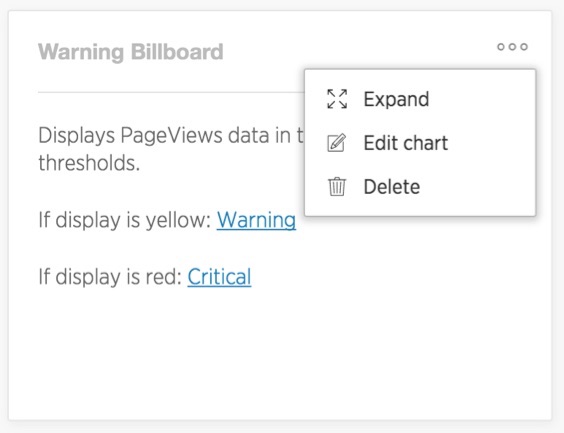
While users have long been able to add notes to individual charts in Insights, there was previously no way to include text content on a dashboard alongside the data charts.
Good news! With Dashboard Notes, users can now create, add, and edit a note on any dashboard. Using Markdown, a simple and widely used formatting syntax, Dashboard Notes makes it easy to add custom content such as text, images, and links that are highly visible and easily accessible. (Note that to avoid potentially private information being shared without authorization, Dashboard Notes cannot be copied to other dashboards within the same account or cross-account.)

Multiple use cases for Dashboard Notes
Furthermore, this feature is incredibly flexible. Here are some sample use cases:
- Create a postmortem dashboard following an incident, including notes about the details of the incident, why it occurred, when it occurred, and so on.
- Attach a runbook URL to a dashboard so engineers and support teams can easily access supplemental information when an incident or outage occurs.
- Add an image, perhaps of the relevant team or the owner of the dashboard, so that everyone immediately knows whom to contact with questions or updates.
- Point users to external links, such as a source repo or other relevant dashboards.

Ultimately, Dashboard Notes is designed to let users add flexible and editable context that can be easily viewed and accessed by all the users of the dashboard. For more information, check out the documentation for Dashboard Notes here.

As opiniões expressas neste blog são de responsabilidade do autor e não refletem necessariamente as opiniões da New Relic. Todas as soluções oferecidas pelo autor são específicas do ambiente e não fazem parte das soluções comerciais ou do suporte oferecido pela New Relic. Junte-se a nós exclusivamente no Explorers Hub ( discuss.newrelic.com ) para perguntas e suporte relacionados a esta postagem do blog. Este blog pode conter links para conteúdo de sites de terceiros. Ao fornecer esses links, a New Relic não adota, garante, aprova ou endossa as informações, visualizações ou produtos disponíveis em tais sites.


