In today's rapidly-evolving technological environment, mobile applications are an indispensable tool for individuals and businesses. From shopping and entertainment to communication and productivity, these apps have revolutionized the way we live and work by providing us with the convenience of accessing information and services on the go.
Without proper monitoring, application crashes go unaccounted for, leading to frustrated customers and lost revenue. That's why it's crucial for developers to implement a comprehensive and proactive monitoring system that can track app performance and detect issues before they become major problems. However, gaining visibility into the performance of mobile apps can be difficult. For example, manually configuring custom dashboards that compile crash analytics and network performance issues can be a time-consuming and complex process that diverts valuable team resources.
This is where New Relic instant observability solutions come into play. These are pre-built solutions that work across your whole stack. In this blog post, you'll learn about the Mobile Crash Analytics dashboard and the Mobile Network Performance dashboard and how you can use them to monitor your mobile apps in real time and proactively detect issues. With these dashboards, you can leverage data-driven insights to optimize the performance of your mobile applications and enhance customer experience which can improve business outcomes.
The Mobile Crash Analytics dashboard
A common issue that people face while using mobile apps is unexpected crashes. Various factors, such as memory leaks, null pointer exceptions, or database issues can cause these. When an app crashes, it can impact the customer experience and lead to negative reviews and ratings.
To troubleshoot and get visibility into crashes, install the Mobile Crash Analytics quickstart dashboard. This pre-built dashboard provides specific information on the types of crashes that occur, such as:
- Application platform
- Version
- Device OS
- Manufacturer
The dashboard also provides you with an in-depth analysis of crash trends on a weekly basis. With the added functionality of applying filters on widgets, you can easily narrow your search and gain valuable insights into your application's performance.
Install the Mobile Crash Analytics quickstart for a pre-built dashboard that helps you better understand and troubleshoot crashes.
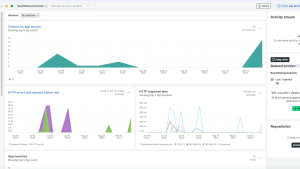
Easily see crash trends over time.
The Mobile Network Performance dashboard
Mobile apps rely heavily on network connectivity to deliver content and services to customers. Network issues such as slow loading times, timeouts, and connectivity problems can impact a customer's experience and lead to a decrease in app usage.
To get full observability into your mobile app’s network performance, install the Mobile Network Performance quickstart dashboard. This pre-built dashboard provides an in-depth review of the HTTP issues and network problems that happen within different application platforms. You'll learn about the proportion of people impacted by these problems, as well as traffic peaks, transaction histograms, and geographic information for finding and correcting performance bottlenecks in your application.
Install the Mobile Network Performance quickstart for a pre-built dashboard that helps you ensure ongoing mobile network reliability.
Easily view network failures across different app versions, type of network problems and different failure spikes.
How to instrument your mobile app with New Relic
What do you need to successfully start monitoring your mobile application with New Relic quickstart dashboards? New Relic requires you to instrument your mobile application. You'll incorporate New Relic's mobile SDKs into your application's code, allowing your app to transmit performance data to the New Relic platform. With New Relic’s mobile monitoring, you'll get:
- The ability to monitor iOS and Android as one.
- The ability to monitor hybrid apps in React Native, Flutter, Cordova, Ionic, and Xamarin.
- Pre-built and curated data visualizations.
The instrumentation process is platform-agnostic, meaning that regardless of whether the application is a native iOS app, an Android app, or a cross-platform app built with React Native or Flutter, New Relic can instrument it. Follow Introduction to Mobile Monitoring to learn how to instrument your mobile app with New Relic.
How to install the pre-built dashboards for mobile apps
Once you have instrumented your mobile apps, it's easy to get started with the Mobile Crash Analytics and Mobile Network Performance dashboards:
- Login to your New Relic portal.
- Click on Dashboards, and then select Create a dashboard.
- Select Browse pre-built dashboards, then find the Browser & mobile category or search with the keyword “mobile”, just as it's shown in the next image.
- Click on the mobile dashboard you want to use, and choose the account you wish to pull data from.
- Once the dashboard is provisioned, simply click on View dashboard to start exploring your mobile data insights.
Conclusion
There are various definitions to describe data visualization, but they all revolve around a common idea: transforming complexity into simplicity. This is possible with the New Relic observability-driven dashboards for mobile application crashes and network performance. With real-time visibility into the performance of your mobile app, you can easily identify and troubleshoot issues, optimize the performance of your mobile app, and improve your business outcomes.
Próximos passos
Install these quickstarts today to improve the performance of your mobile app:
Don’t have New Relic yet? Sign up for a free account. Your account includes 100 GB/month of free data ingest, one free full-access user, and unlimited free basic users.
As opiniões expressas neste blog são de responsabilidade do autor e não refletem necessariamente as opiniões da New Relic. Todas as soluções oferecidas pelo autor são específicas do ambiente e não fazem parte das soluções comerciais ou do suporte oferecido pela New Relic. Junte-se a nós exclusivamente no Explorers Hub ( discuss.newrelic.com ) para perguntas e suporte relacionados a esta postagem do blog. Este blog pode conter links para conteúdo de sites de terceiros. Ao fornecer esses links, a New Relic não adota, garante, aprova ou endossa as informações, visualizações ou produtos disponíveis em tais sites.


