Don’t miss part two in this series: Effective Strategies for Kafka Topic Partitioning.
New Relic was an early adopter of Apache Kafka; we recognized early on that the popular distributed streaming platform can be a great tool for building scalable, high-throughput, real-time streaming systems. We’ve built up a lot of experience on how to effectively spread processing load for maximum scalability.
The Events Pipeline team is responsible for plumbing some of New Relic’s core data streams—specifically, “event data.” These are fine-grained nuggets of monitoring data that record a single event at a particular moment in time. For example, an event could be an error thrown by an application, a page view on a browser, or an e-commerce shopping cart transaction.
In this post, we show how we built our Kafka pipeline so that it stitches together microservices and serves as a changelog and “durable cache,” all with the idea of processing data streams as smoothly and effectively as possible at our scale. In an upcoming post, we’ll share thoughts on how we manage topic partitions in this pipeline.
This post assumes familiarity with the basics of Kafka, including consumer groups, partitions, and offsets. All of the examples were built using the consumer and producer APIs. (Note that this post is not about managing or troubleshooting a Kafka cluster. For that, see Kafkapocalypse: Monitoring Kafka Without Losing Your Mind.)
Stitching together microservices
New Relic runs a fairly sizeable assortment of microservices, managed by more than 40 agile engineering teams, all dependent on one another. Because of its scalability, durability, and fast performance, we’ve found that Kafka is a great way to move data between our different services. The asynchronous nature of passing messages via topics facilitates decoupling of the services, reducing the impact changes or problems in one service will have on another. We use it for queuing messages, parallelizing work between many application instances, and for broadcasting messages to all instances (which I’ll discuss later).
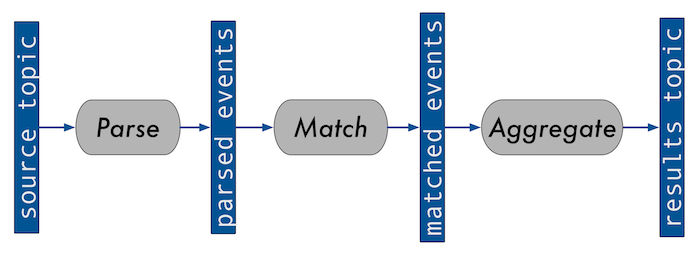
We have a chain of stream processing services, each running in a separate container, that operates on the event data in series. We connect those services together via Kafka topics; one service produces messages onto a topic for the next service to consume and use as input. For example, the diagram below is a simplification of a system we run for processing ongoing queries on event data:

Batches of events stream in on the source topic and are parsed into individual events. Then, they are matched to any existing queries in the system. The last step aggregates events into time windows, outputting the result of the query onto a result topic. Note that we use event time—processing events as they occur—to determine window membership.
Because stitching these services together with Kafka allows decoupling, a problem on one service does not cause issues with other services. We’re also able to dynamically deploy more or fewer instances of each application depending on traffic volume. We can have Kafka automatically rebalance the load.
We separated the event-driven processes (parse and match) from the time-based process (aggregate). Event-driven processes are easy to reason about, but as generations of programmers have learned, time is often hard to handle. That’s why we isolated the tricky time logic into its own service.
Using Kafka as a changelog
A changelog is data contained on a topic that is intended to be read through from start to finish, most likely when an application starts up. The goal is to rebuild the state by replaying history. The service may continue to listen for updates. Each consumer has its own (or no) group and restarts to the earliest offset.
So, back to the example of our query system for events data. Our query API produces to a queries topic. Each service subscribes to (consumes) that queries topic. When a service starts up, it consumes the queries topic from the earliest offset, and thus reads through the whole topic and continues to get updates this way. This unifies the startup and listen process, as the consumer and handler can run in the same manner throughout the lifetime of the service.
Often, this can be a useful alternative to polling a database.
You have two topic retention options in this situation. The first option is to set the topic retention time long enough to catch all the messages you need to rebuild your state. The other option is to use log compaction. This indefinitely retains the most recent copy of a message for each key. In either situation, keep in mind how many messages will be on the topic, and how quickly your service may take to read through the entire topic when it rebuilds its state upon startup.
In our query API, all queries registered with the system have a maximum time to live (TTL) of 1 hour. Thus we know that all queries are either retained for one hour, manually canceled, or updated with a new message placed on the queries topic. When we first developed this system, we generously set topic retention at two hours. But we found that applications that consumed this topic were increasing slow to start up, taking minutes to crunch through the queries topic, when we’d expected this to take only seconds. It turned out that we had failed to adjust the log segment size—which defaulted to one week—to match the retention period. To fix this, we set the segment.ms to match the retention.ms, and watched our topic consumption times go way down.
As the system evolves, we are looking into getting rid of the query TTLs. If, or when, this happens, we’ll move to using log compaction instead of time retention.
Kafka as a state cache
We use Kafka topics to store and reload state that has been snapshotted. This is what I call, for lack of a better term, a “Durable Cache," which means using Kafka topics to store and reload snapshotted state.
Here’s how it works:
A stateful service, which we’ll assume also gets its input data from a Kafka topic, frequently produces current state to a “snapshots” topic. This “snapshots” topic has a 1:1 match in partitions to the “main” consumed topic. In other words, if an application instance is consuming and processing data from partition 2 on some topic, the instance will produce snapshots of that state to partition 2 on the “snapshots” topic. Generally speaking, the “snapshots” topic needs only a short retention, as much more data will be produced than consumed.
When an instance starts up, it gets its assignment from the “main” consumed topic. It then uses a static partition assignment to read in the entire snapshots topic from the same partitions. The starting offset for where to resume consuming on the main topic is derived from the metadata saved in the snapshots.
To return to the example from our aggregator service, that service builds up state for up to several minutes before publishing a result. This is a high-throughput, real-time system, so backing up several minutes worth of data in the ingest topic when the service was restarted was not feasible. Thus, we started saving snapshotted state to a “snapshots” topic that mirrored the main ingest topic in partition count. We also produce publish messages to the “snapshots” topic to determine when to ignore snapshots. We save the latest offset on the ingest topic associated with the data in the snapshot itself, and use it to figure out our starting point on the ingest topic.

For example, if we have one instance per ingest topic partition and an instance gets assigned partition 7 of the matched events topic on startup, it will read all the snapshots from partition 7 of the snapshot topic. It will use the snapshot metadata to determine the starting offset to start reading from in the matched events topic and start consuming from partition 7 of the matched events topic and processing data. It will then save new snapshots and publish markers to partition 7 of the snapshots topic on an ongoing basis. Results are published to the appropriate (and unrelated) partitions on the results topic.
One might think that log compaction would be useful here. However, manual de-duplication would still be necessary, as log compaction does not work instantaneously. Log compaction is run only at intervals and only on finished log segments. Thus, to rebuild the state reliably, data would need to be de-duplicated to make sure that only the most recent snapshot is used.
Note that we considered other database or cache options for storing our snapshots, but we decided to go with Kafka because it reduces our dependencies, it’s less complex relative to other options, and it’s fast.
Stream processing and concurrency
We’ve found the disruptor pattern, specifically the LMAX disruptor library, to be incredibly useful and complementary for high-throughput Kafka services.
The disruptor is similar to an asynchronous blocking queue, backed up by a circular array that distributes or multicasts objects to the worker threads. It has a good story with respect to throughput and latency. It pre-allocates the objects on the buffer ring and reuses them, saving on garbage collection.
In addition to being an efficient mechanism to gain application concurrency, this strategy has the great advantage of only needing to reason about each handler in a single-threaded manner.
In all our services, we use the disruptor pattern to parallelize processing data from one or more consumed partitions. We’re putting the concurrency where it’s needed most, which for us typically means fanning out messages to handler threads to be decompressed and deserialized, along with the business logic processing.
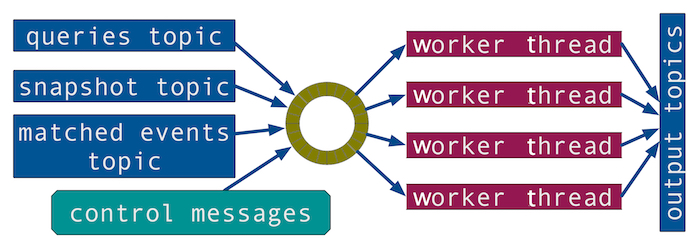
We also use the disruptor handlers to update state concurrently. We blend together consumers from different topics via the disruptor to manipulate shared state in a thread-safe way. We do this in all our applications, and the diagram below depicts the high-level structure of the aggregator service.

In addition to Kafka messages, we also pass programmatically generated control messages through the disruptor, such as timing ticks that tell the handler threads to check for aggregates to finish and publish. We don’t need additional locking/synchronization mechanisms around these different data sources; the handler threads will read only one message of any type at a time.
Scalability is an ongoing process
There are a lot of great and compelling streaming systems being built around Kafka. As your business needs scale, having strategies for effectively spreading processing load is an important part of increasing scalability. Additionally, reducing dependencies and complexity can help increase code maintainability and reliability. New Relic’s Events Pipeline has come a long way, and as we continue to grow, we keep finding new ways to make the most of Kafka.
Read part two: Effective Strategies for Kafka Topic Partitioning.
As opiniões expressas neste blog são de responsabilidade do autor e não refletem necessariamente as opiniões da New Relic. Todas as soluções oferecidas pelo autor são específicas do ambiente e não fazem parte das soluções comerciais ou do suporte oferecido pela New Relic. Junte-se a nós exclusivamente no Explorers Hub ( discuss.newrelic.com ) para perguntas e suporte relacionados a esta postagem do blog. Este blog pode conter links para conteúdo de sites de terceiros. Ao fornecer esses links, a New Relic não adota, garante, aprova ou endossa as informações, visualizações ou produtos disponíveis em tais sites.


