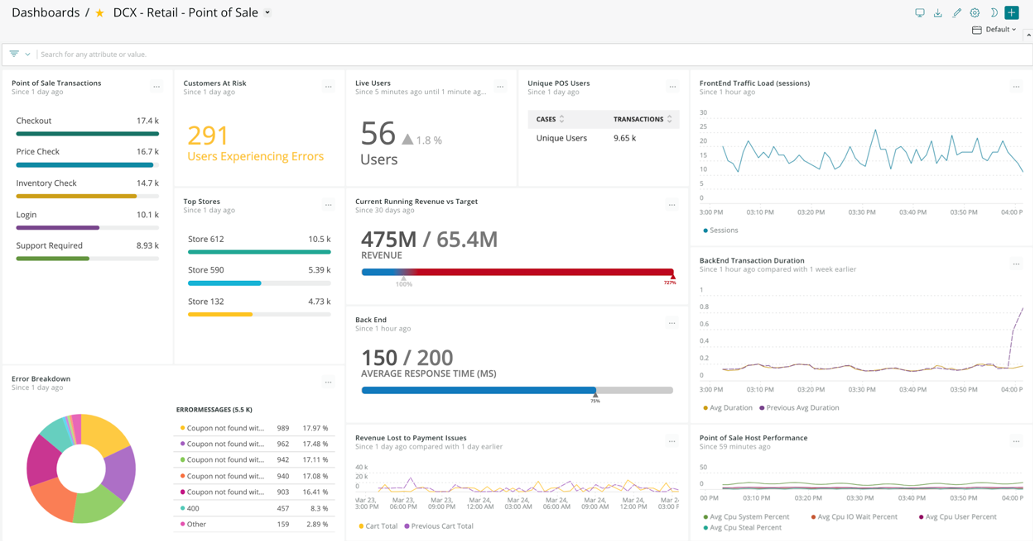
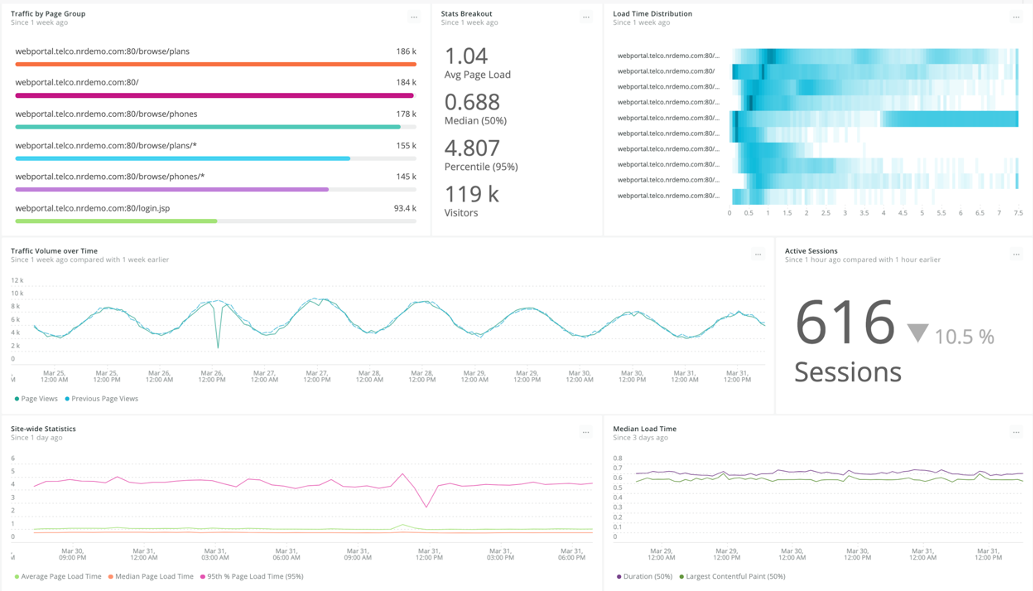
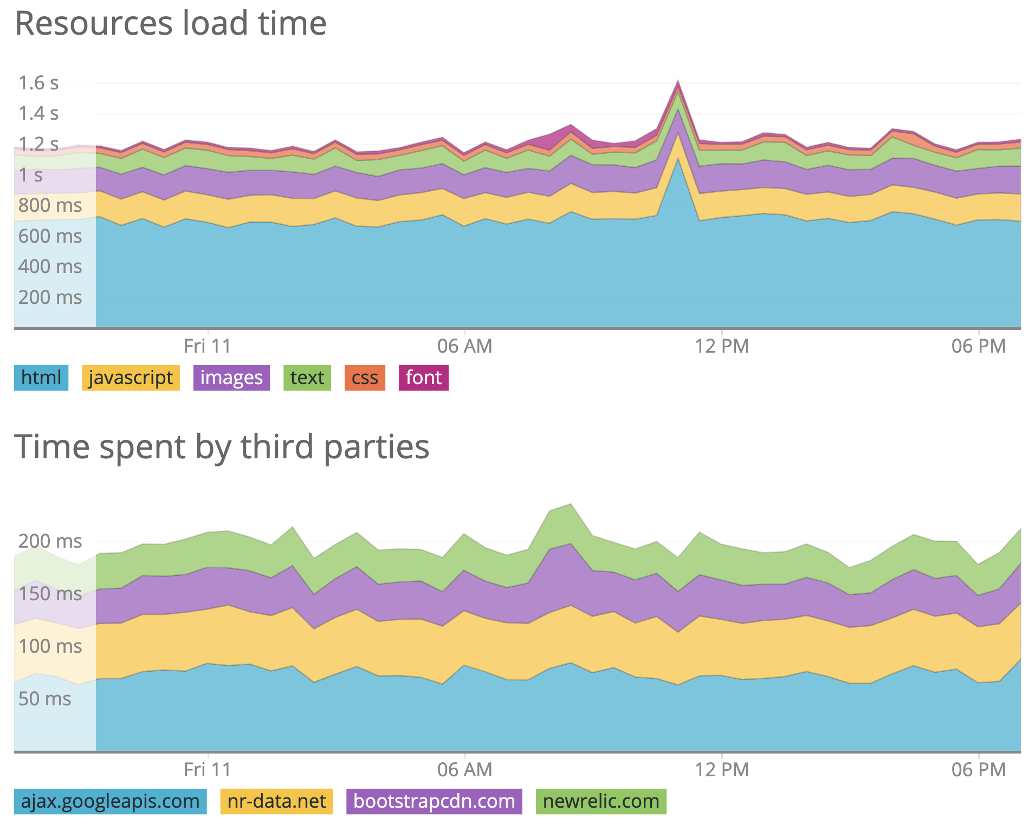
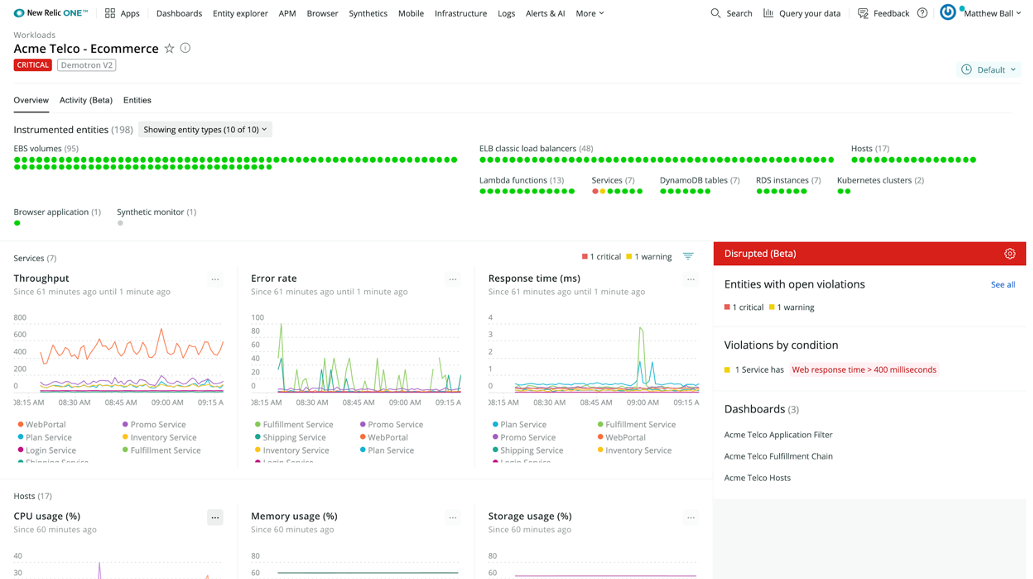
As COVID-19 has accelerated the world’s migration online, companies are more focused than ever on their digital experience. Keeping customers happy through website speed, availability, and performance is paramount. And outages are costly: According to Gartner, companies lose an average of $5,600.00 per minute, or over $300,000.00 per hour when their sites are unavailable—and that was in 2014.
Speed matters: BBC found that for each second of increased page load time, 10% of users leave the site. And in general, monitoring, measuring, and improving your digital properties is your key to creating great digital customer experiences—a capability that has a direct impact on your business outcomes.
Many site owners rely on Real User Monitoring (RUM) and synthetic monitoring, two major components of Digital Experience Monitoring (DEM), to measure uptime and performance.
At a basic level, developers and IT Ops teams use RUM and synthetics to ensure that critical endpoints are available and deliver pleasant customer experiences. On a deeper level, RUM and synthetics helps teams:
- Proactively improve uptime for critical service, API, and third-party dependencies
- Drive successful deployments by finding and eliminating errors, slowness, and poor functionality before pushing to production
- Improve customer experience by delivering content faster, improving page interactivity, and visual stability
The promise of RUM and synthetic monitoring is teams proactively ensuring great customer experience, and making informed decisions that improve digital business results.
In this post, we’ll explain three big themes for your customer experience:
- Frontend (end user) monitoring is a critical component of your digital business strategy. It’s also absolutely essential to understand your end user experience, and the relationship between website performance, customer experience, and the result to your business.
- Synthetic and real-user monitoring (RUM) provide deep, complimentary visibility to your end-user experience. The two are highly complementary; some teams find it useful, and even essential, to use them in tandem.
- The best monitoring strategies provide end-to-end observability. This approach gives developers a single, holistic framework for improving the digital customer experience through every layer of the stack.
Frontend monitoring: why it’s different—and why it’s essential
Frontend monitoring, commonly referred to as “client side monitoring,” focuses on measuring what happens after the server has sent information to the web browser and your end users. As a result, there is proven value when using a frontend monitoring solution:
- Understanding customer experience: The need to answer basic questions about customer experience is critical for a digital business: Can users access our site? Is our site fast enough? Do all the features and components of our site work? After ensuring basic availability, performance, and functionality are key themes for site owners. Ultimately, customers will find problems. However, frontend monitoring tools can help teams proactively measure performance in a staging environment, and then observe real user experience from the vast combination of customers, device types, networks, and browser types typically seen in production environments.
- Measuring the health of endpoints, APIs, and third parties: Modern web pages rely heavily on microservices, APIs, and third parties to deliver information to web browsers and end-users. Synthetics tests and monitors ideally inform site operators if service endpoints, APIs, and third party components are up, fast, and providing valid results and information that power satisfying end-user experience.
- Managing inter-reliant technologies and distributed systems: A modern website is complex and delivers experiences through a dynamic collection of frameworks, APIs, images, third-party services, plugins, content platforms, and more. Part of “job one” for a company is to build a site that satisfies users regardless of location, network, or device. Frontend monitoring can answer questions of performance amidst hundreds of resources, API calls, application transactions, and services being pushed from the server to the browser.
- Empowering digital business with customer feedback: Monitoring end user experience can help inform key technology and business decisions. Beyond basic availability, teams harness end user data to help answer questions about how fast they need to be to increase key metrics like the amount of checkouts or ad clicks. Digital businesses that successfully measure end-users data are able to quantify the business impact of slow websites.

RUM vs. synthetic monitoring
There are two approaches for monitoring critical endpoints and the end-user experience. The first, referred to as real-user monitoring (RUM), collects timing and performance information from users visiting websites and applications. RUM is referred to as “field data” because it represents a varied, sometimes dizzying, combination of real users accessing your site on different networks, web browsers, geographies, device types, each with their different version.
The second approach, known as synthetic monitoring, informs uptime, functionality, and performance by proactively simulating user transactions to a website. The term “lab data” derives from the fact that synthetic tests or monitors typically use fast network connections, with predefined conditions (selected web browsers, geographies, and URLs), to inform IT operators about the health of critical endpoints or user flows. Combined, RUM and synthetics are commonly referred to as lab data and field data.
Real-user monitoring (RUM): what end-users experience
Real-user monitoring, as the name suggests, measures actual user interactions with a website or web application. This is commonly referred to as passive frontend monitoring: The solution relies on actual user traffic to collect metrics.
A site owner usually implements a RUM solution by placing a snippet of JavaScript code on a site’s page headers. When a user visits the page, this script captures basic information about the user and their experience:
- Timing or performance measurements (commonly captured by the navigation timing API)
- Dimensional details about end users, like the web browser type and version, operating system, device type, their geographic location (based on their IP address)
- Information on errors (such as JavaScript errors)
Real-user monitoring helps site owners troubleshoot immediate issues, and optimize customer experience.
Short-term troubleshooting considerations:
- Did our latest deployment improve page speed and performance??
- Which JS errors are most impactful to customers?
- Is our site experience consistent across web browsers, devices, and geographies?
Long-term optimization considerations:
- How fast does our page need to render to increase order value?
- How should we design our pages to decrease abandonment?
- Should we establish a “center of excellence,” “speed team,” or performance budgets to improve our end user experience?

Synthetic monitoring: proactively ensuring uptime, functionality, and performance
Synthetic monitoring, by comparison, is referred to as “active monitoring.” Ideally synthetic monitoring proactively identifies and helps resolve site issues before customers notice. It measures frontend performance by simulating user activity and by tracking and analyzing the results of these simulated interactions.
Synthetic monitoring solutions provide dependable, predictable, and highly-consistent tools for monitoring availability, functionality, and performance of your critical endpoints, user pathways, and APIs.
- Uptime of critical endpoints and APIs. Synthetic monitoring answers the uptime question for critical service and API endpoints. Because synthetic tests continuously provide feedback, synthetic monitoring solutions will typically be the first place teams go to troubleshoot issues. If a site is down, synthetic monitors help address the impact and scope of what’s affected as teams communicate severity and coordinate a response.
- Functionality of page components. For every button, link, and interactive element on a site, synthetic monitoring answers the question, “Does my site function as intended?” Synthetic workflows regularly traverse key user paths, clicks, and interactions, to ensure that users won’t encounter broken, missing, or mislabeled features.
- Page performance. Synthetic monitoring answers the question, “How fast are we?” Modern synthetic monitoring solutions return full page timing information—including full page load time and performance of all page assets and third parties—across common user pathways.
- Competitive benchmarking. Synthetic monitoring can also answer the question, “How fast is our competition?” Often, businesses try to optimize site speed and performance; however, as there’s no current method to reduce page speed to 0 seconds, a sound way to establish performance goals is to compare your site speed against your competition.
Synthetic monitoring is used heavily as a first-response for troubleshooting failures and outages, but can also help inform longer-term decisions about optimization:
Short-term troubleshooting considerations:
- What is the extent or severity of an outage?
- Are our services failing, or is the problem from an API, third party, or internet service provider?
- Where can we tune performance while still in staging, before deploying to production?
Long-term optimization considerations:
- How fast are we compared to our competitors and industry?
- How can we continuously improve deployments within our CI/CD pipeline?
- How does page weight and total resources (first and third party) impact speed and performance?

Observability requires an end-to-end view of system health
Successful digital businesses provide value (increased uptime, increased customer satisfaction, and increased revenue) by improving uptime and performance for both their frontend and backend. As your end-user experience represents the combined sum of infrastructure, databases, services, and APIs each being constantly updated or re-configured, consider a few ways to minimize the impact of change to your customers with New Relic One:
- Troubleshoot the full-stack, faster. Connect endpoint availability against the health of its underlying services within the Synthetics results page. Use New Relic Workloads to visualize the health of a group of connected components (aka entities) that make up a specific service. MELT (metrics, events, logs, traces) visualizes your system components in context and automatically surface issues and signals that might otherwise go undetected. Our Kubernetes cluster explorer can illustrate the health of your endpoints as you quickly scale environments.
- Embrace cloud migration and its technologies with confidence. Use service-maps to observe in real-time how microservices architectures are performing (transaction time, response time). As you adopt new cloud services like serverless functions or cloud databases, monitor performance and establish custom alerts to tune processes.
- Debug with end-user context and code-level visibility. Receive context of customer-impact, with code-level visibility of stack traces and error details—down to the log level—to quickly understand the issue, trace its impact throughout the stack, recreate it locally, and resolve it. Whether it’s JS errors in the web browser, errors from native mobile apps, unhandled exceptions, or any system anomaly impacting your end-users, New Relic is your first class tool for debugging.
- Check performance of third-party services. Third party-services for data, email, messaging, content, and other functions are useful. But they can also create backend dependencies that raise the risk of degradations or crashes. Tools such as New Relic Integrations and our Synthetics API can simplify the process of monitoring essential third-party services and decoupling them if necessary.

Deliver great digital customer experiences
If you take away one thing from this article, it should be this: A comprehensive, and fully integrated, set of monitoring capabilities is one of your most important tools for delivering great digital customer experiences.
It’s not a question of choosing between synthetic and real-user frontend monitoring; or deciding whether to focus on frontend or backend monitoring. You need all of these monitoring capabilities working for your team—and the more closely they work together, the more success you’ll have delivering a truly exceptional digital customer experience.
Combine RUM, synthetic, and native app monitoring to proactively ensure uptime and performance across services, URLs, APIs, and third party resources on web and mobile with Full-Stack Observability in New Relic One. Sign up for free and start today.
As opiniões expressas neste blog são de responsabilidade do autor e não refletem necessariamente as opiniões da New Relic. Todas as soluções oferecidas pelo autor são específicas do ambiente e não fazem parte das soluções comerciais ou do suporte oferecido pela New Relic. Junte-se a nós exclusivamente no Explorers Hub ( discuss.newrelic.com ) para perguntas e suporte relacionados a esta postagem do blog. Este blog pode conter links para conteúdo de sites de terceiros. Ao fornecer esses links, a New Relic não adota, garante, aprova ou endossa as informações, visualizações ou produtos disponíveis em tais sites.


