Production JavaScript has changed dramatically, with transpilation, bundling, and minification emerging as new standards for how this frontend code is processed. We had previously announced our source map support for New Relic Browser during our recent platform update, and we’re happy to share that’s it is now generally available.
Our source map support is designed to make it easier to troubleshoot JavaScript errors by mapping the location of the issue in the original source code, helping you find and fix issues in your frontend faster. This new release includes both an intuitive drag-and-drop option within your New Relic Browser dashboard, for quick and easy mapping on the fly, as well as a robust API to integrate into your build systems for automated and seamless JavaScript troubleshooting.
The evolution of JavaScript processing
For all the talk of frontend fatigue, and frustration with the vast array of build systems, right now is a great time to be writing JavaScript. The new features in the language are powerful, and thanks to the “magic” of transpilation they are safe to use in almost any browser. However, transpilation and the more common practices of bundling and minification can obfuscate frontend code and make it difficult to pinpoint where an error occurred in your original source code.
It can be painful to see that a customer encountered a JavaScript error when you have no clear way to fix it. Fortunately, we have a way to make these errors actionable even when using the latest frontend technology.
Source map support for New Relic Browser
JavaScript build systems can generate a source map, which is like a magic decoder ring for transpiled or minified code. Your local dev tools have the ability to read these maps and automatically un-minify JavaScript, allowing you see the original code in the browser debugger.
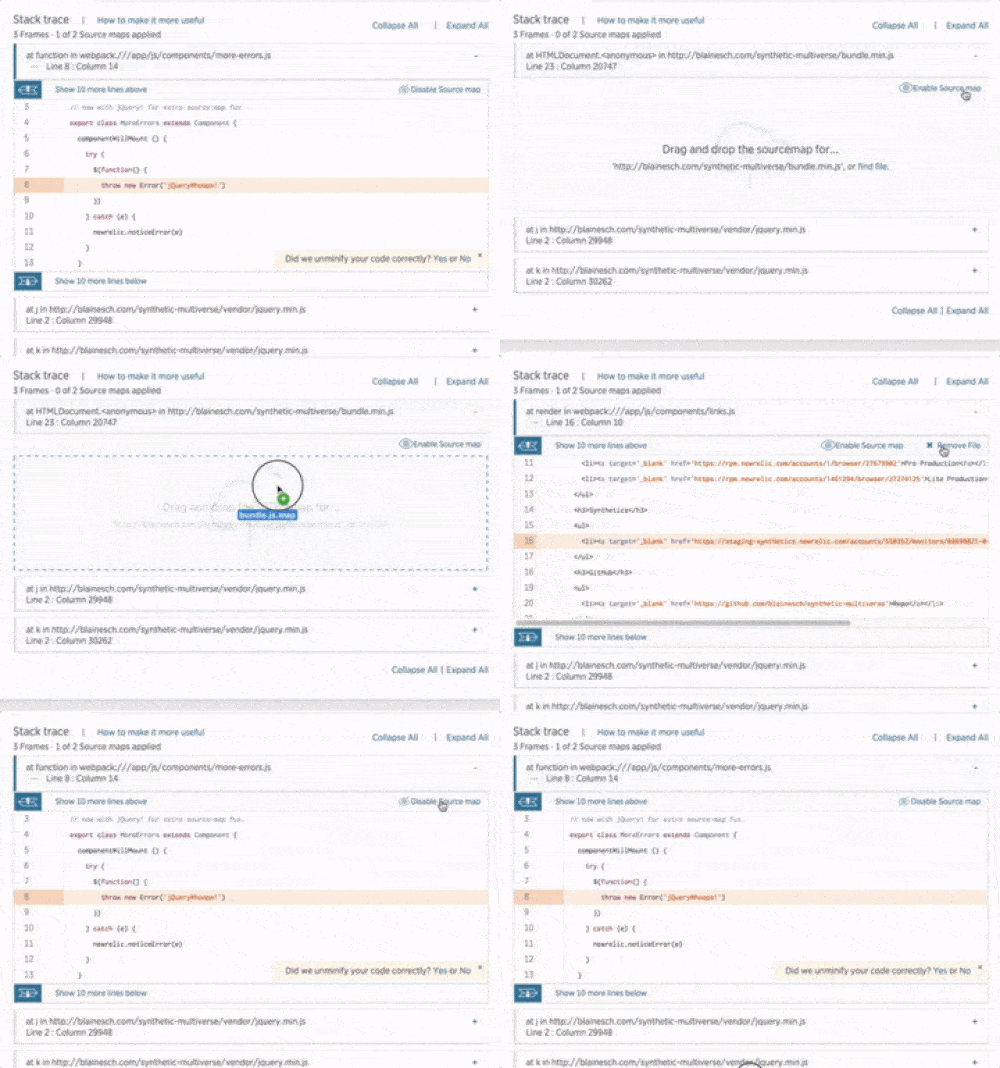
Now you can use these same source maps in New Relic. When looking at the details of an error, we can apply the source map and show you the error in the context of the original source code, just as the engineer wrote it. This makes debugging customer errors much easier. We’ve made the process as simple as dragging the source map for the JavaScript error into your New Relic Browser screen, and the feature can show you exactly where in the original source the error occurred, including syntax highlighting!

Automating source maps in your build pipeline
While drag-and-drop is great for troubleshooting JavaScript errors on the fly, DevOps teams that deploy code multiple times to multiple applications may want a more automated way to handle the large number of source maps that are generated every time they run a build. Our source maps API makes it easy to publish the source maps to New Relic Browser every time a new build is deployed. Include it as part of your build system, and your JavaScript errors will automatically be pre-mapped whenever you open them up in New Relic Browser.
In order to publish source maps, you need a few pieces of information:
- A New Relic admin API key for the account, available here (--nrAdminKey)
- The New Relic application ID for the deployed app (--applicationId)
- The URL for the JavaScript as it is included on the page (javascriptUrl)
- Optionally, a release name and identifier if the URL is not unique each time you deploy (--releaseName) (--releaseId)
The easiest way to publish source maps is to use our new @newrelic/publish-sourcemap npm module. It provides a command line tool and JavaScript API designed to accomplish this task, and more documentation is available on the NPM page.
Using the npm module to publish from the command line:
npm install -g @newrelic/publish-sourcemap


publish-sourcemap ./dist/overview_page.min.js https://bam-ui.nr-assets.net/overview-64.min.js --nrAdminKey=[APIKEY] --applicationId=1441
Using the npm module to publish from Javascript:
var publishSourcemap = require(‘@newrelic/publish-sourcemap’)


publishSourcemap({

   sourcemapPath: ‘./dist/bundle.min.js.map’,

   javascriptUrl: 'https://bam-ui.nr-assets.net/overview-64.min.js'

   applicationId: 518867,

   nrAdminKey: 'dkdkx03l'

}, function (err) { console.log(err || 'Sourcemap upload done')})
Source maps can also be published directly using a cURL command:
curl -H "Newrelic-Api-Key: <nr admin api key>"

   -F "sourcemap=@./dist/overview_page-142.min.js.map"

   -F "javascriptUrl=https://bam.nr-assets.net/overview_page-142.min.js"

   -F "releaseId=142" \

   -F "releaseName=overview_page" \
Better JavaScript error troubleshooting
New Relic Browser is all about exposing the end user experience of your software, and JavaScript errors are one of the most actionable types of data it exposes. Reducing client-side errors can have a direct, immediate, and quantifiable impact on the end user experience. Source map support in New Relic Browser is part of our ongoing investment in making sure you have the visibility and simplified workflows you need to make sure your apps run smoothly for your customers.
Additional Resources:
- Technical Docs: New Relic Browser Source Map Support
- Technical Docs: New Relic Browser Source Map API
- Technical Docs: New Relic Release API
In a companion blog post—Getting Things Set Up With New Relic Browser Source Maps—we walk you through how to integrate source maps into your build pipeline so you can have JavaScript error details automatically mapped.
이 블로그에 표현된 견해는 저자의 견해이며 반드시 New Relic의 견해를 반영하는 것은 아닙니다. 저자가 제공하는 모든 솔루션은 환경에 따라 다르며 New Relic에서 제공하는 상용 솔루션이나 지원의 일부가 아닙니다. 이 블로그 게시물과 관련된 질문 및 지원이 필요한 경우 Explorers Hub(discuss.newrelic.com)에서만 참여하십시오. 이 블로그에는 타사 사이트의 콘텐츠에 대한 링크가 포함될 수 있습니다. 이러한 링크를 제공함으로써 New Relic은 해당 사이트에서 사용할 수 있는 정보, 보기 또는 제품을 채택, 보증, 승인 또는 보증하지 않습니다.


