The landscape of AI is rapidly evolving. Powerful new AI models like Sora, Mistral Next, and Gemini 1.5 Pro are pushing the boundaries of what's possible. Businesses everywhere are eager to leverage these advancements and create groundbreaking experiences for their customers.
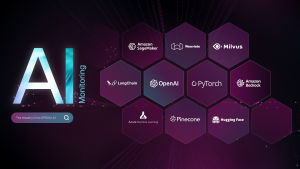
At New Relic, we understand the immense potential of generative AI, and that's why we built New Relic AI—a generative AI solution designed to democratize observability. Our extensive experience in developing New Relic AI has provided us with a deep understanding of the inherent challenges involved and the critical need for robust AI monitoring solutions. That's why we introduced New Relic AI monitoring—the industry's first application performance monitoring (APM) solution for AI that provides unparalleled visibility into the entire AI application stack.
But New Relic AI monitoring isn't just for us—it's for everyone! We want to empower organizations of all sizes to embark on their AI journeys with confidence. That's why we're thrilled to announce the general availability (GA) of New Relic AI monitoring. This powerful new addition to New Relic platform’s 30+ capabilities empowers you to monitor, manage, and optimize your AI applications for performance, quality and cost.
In this blog post, we'll use a simple chat service built with OpenAI's large language models (LLM) and LangChain to demonstrate the power of New Relic AI monitoring. We'll explore its features and walk you through how to leverage it to debug errors in your AI application's response.
Effortless instrumentation and onboarding
With New Relic auto-instrumentation capabilities, integrating AI monitoring into your workflows is seamless and intuitive. Whether you're using popular AI frameworks like OpenAI or Amazon Bedrock, our agents provide effortless instrumentation across Python, Node.js, Ruby, Go and .NET languages. Through a guided install process, you can set up instrumentation for monitoring your chat application in just a few clicks, ensuring you're equipped to monitor your AI applications from the get-go.
Take, for instance, the simple chat service. Here’s how you can get started :
- Navigate to Add Data within New Relic and then select AI Monitoring.
- Under AI Monitoring, choose the framework you want to instrument; for example, OpenAI Observability.
- Select the instrumentation agent—in this case, Python—and then follow the clear step-by-step instructions to complete instrumentation.
Gain instant insights into model usage
Managing and optimizing AI models can be complex, but AI Model Inventory simplifies the process by offering a unified, comprehensive view of your model usage. With complete visibility into key metrics across all your models, it becomes effortless to isolate and troubleshoot performance, error, or cost-related issues.
Here's how you can use AI Model Inventory:
- Within New Relic, navigate to AI Monitoring.
- Under the capability section, select Model Inventory.
- The Overview tab provides a summary of all requests, response times, token usage, completions, and error rates across models for all services and accounts. Click on any completion in the completion table to access the deep trace view, where you can see the entire flow from request to response.
- Click on the Errors tab to view errors across all models. Now you can easily isolate the most common errors and models with the highest error rates, facilitating efficient root-cause analysis and faster resolution.
- Next click on the Performance tab to view the total number of requests and response time by model. This allows you to quickly identify and optimize underperforming models.
- Click on the Cost tab to view token usage per model, as well as prompt and completion token usage by model, helping you identify cost-saving opportunities.
- Use data filters to refine your analysis by service, request, or response. This allows you to gain deeper insights and tailor your analysis to specific needs, enhancing your ability to manage and optimize your AI models effectively.
By leveraging AI Model Inventory, you can ensure that your AI models perform optimally, maintain high reliability, and operate cost-efficiently, providing a robust foundation for your AI-driven initiatives.
Full stack visibility for AI applications
Once your AI application is instrumented, New Relic AI monitoring provides unparalleled visibility into its performance and behavior. New Relic AI monitoring goes beyond traditional application performance monitoring (APM) by seamlessly integrating with APM 360. This powerful combination provides a unified view of your AI ecosystem, giving you not only the standard APM metrics you expect (response time, throughput, error rate) but also AI-specific metrics like total requests, average response time, and token usage, all of which are crucial for optimizing your AI application. This empowers you to monitor your entire AI environment effectively within a single interface.
Let’s see this in action for the chat service.
- Within New Relic, navigate to AI Monitoring.
- Click on AI Entity and then select your chat service.
- The Summary view displays both application and AI metrics side-by-side.
Under the AI response widget in the summary view, you can see the chat service has processed 2.83k total responses with an average response time of 7.1 seconds and average token usage of 858 tokens per response.
Quickly identify outliers in AI responses
Understanding and analyzing AI responses is made effortless with New Relic AI monitoring. With a consolidated AI responses view, you can quickly identify outliers and trends in LLM responses, enabling you to fine-tune your application for optimal performance, quality, and cost.
Here, we can analyze feedback and sentiment for each AI response, and also filter by various criteria such as request, response, errors, and more
You can access the AI Response view in two ways:
- From the service summary: Click the AI Response widget for a focused view.
- Global view: Click the main AI Response navigation for a consolidated view across all AI entities.
For the chat service, let’s click on the AI Response widget in the summary view. In the AI Response page, let's filter by errors and look at all the AI responses that have an error for the chat service.
Clicking on one of the AI responses with an error will take you to the response tracing view where you can further drill down to find the root cause
Root cause faster with deep trace insights
New Relic AI monitoring takes the guesswork out of debugging complex AI applications. Our response tracing view unveils the entire journey of your AI request, from the initial user input to the final response. New Relic AI monitoring also captures various metadata associated with each request. By clicking on spans, you can access metadata like token count, model information and also view messages exchanged during model calls, enabling granular debugging.
Our integration with LangChain allows for step-by-step tracing, demonstrating how input gets processed through the different AI components, and how outputs are generated. This fine-grained debugging capability is invaluable for troubleshooting complex AI applications.
Remember the error scenario in our chat service? Clicking on the problematic span within the trace reveals detailed error information. This allows you to quickly diagnose and fix the root cause of the issue, getting your AI application back on track in no time.
Optimize performance and cost across your models
Choosing the right AI model for your application is crucial. But with a growing number of options, how can you be sure you're selecting the best one? Here's where New Relic AI monitoring’s AI model comparison comes in, providing valuable insights about the performance and cost of different AI models to help you make informed decisions about the right model that fits your need.
For the simple chat application, here's how to leverage AI Model Comparison in just a few clicks:
- Within New Relic, navigate to AI Monitoring.
- Under the capability section, click on Compare Models.
- Choose the models you want to compare; for example, GPT-4 vs. Bedrock.
- Click on See the Comparison to view detailed results and select the right model for your chat service
Enhanced data security and user privacy
At New Relic, we understand the importance of safeguarding sensitive data. That's why New Relic AI monitoring offers robust security features to ensure compliance and user privacy. With drop filter functionality, you can selectively exclude specific data types (such as personally identifiable information or PII) from monitoring, while our complete opt-out option gives you ultimate control over data transmission, allowing you to disable the sending of prompts and responses through agent configuration.
Setting up drop filters is an easy process. Simply navigate to the Drop Filters section within the AI Monitoring capability. There, you can create filters using New Relic Query Language (NRQL) queries to target specific data types within the six events offered.
다음 단계
Get started today
New Relic AI monitoring empowers you to confidently navigate the ever-evolving AI landscape. With effortless onboarding and comprehensive visibility, you can quickly optimize your AI applications for performance, quality, and cost. Whether you're a seasoned full-stack developer or just starting your journey, New Relic AI monitoring provides the tools and insights you need to unlock the true potential of your AI initiatives. Sign up for a free New Relic account and experience the power of AI monitoring today.
이 블로그에 표현된 견해는 저자의 견해이며 반드시 New Relic의 견해를 반영하는 것은 아닙니다. 저자가 제공하는 모든 솔루션은 환경에 따라 다르며 New Relic에서 제공하는 상용 솔루션이나 지원의 일부가 아닙니다. 이 블로그 게시물과 관련된 질문 및 지원이 필요한 경우 Explorers Hub(discuss.newrelic.com)에서만 참여하십시오. 이 블로그에는 타사 사이트의 콘텐츠에 대한 링크가 포함될 수 있습니다. 이러한 링크를 제공함으로써 New Relic은 해당 사이트에서 사용할 수 있는 정보, 보기 또는 제품을 채택, 보증, 승인 또는 보증하지 않습니다.


