If you’ve ever used a mobile app to do business, you understand the importance of having a great mobile experience. If you’re using a restaurant app to order food and you run into trouble checking out, what are the chances you order from there again? What if you’re using an app to log service tickets and the details don’t show up correctly? A poor experience quickly turns customers away, which could lead to lost revenue.
According to App Annie’s State of Mobile 2021, time spent in business apps grew 275% year-over-year in Q4 2021. That means having a reliable mobile app is increasingly becoming a must-have versus a nice-to-have. This requirement is especially true if most of your customers interact with your business through mobile devices. Even if you don’t support a mobile app today, having a platform that can support mobile traces may be critical to your growth in the future.
So how does distributed tracing factor into running reliable mobile apps? You use distributed tracing to track requests as they originate on mobile devices and travel to your backend services, which might be owned and managed by different teams. Without distributed tracing in place, you may understand there’s an error, but the troubleshooting process is slow due to a lack of visibility into the issue’s source.
Distributed tracing with New Relic mobile monitoring
If you’re not already familiar with New Relic distributed tracing, check out this blog post on getting started. Distributed tracing helps you instrument, propagate context, record, and visualize requests through complex, distributed systems.
With the addition of distributed tracing for mobile monitoring in New Relic One, mobile app engineers responsible for app performance can quickly discover which backend services are impacting the customer experience. Similarly, when a backend service is experiencing an issue, backend engineers now understand how that issue affects customers. Both frontend and backend developers can now see traces that originate from a mobile device.
What if I already have mobile agents deployed?
If you haven’t updated your mobile agents lately, you’ll need to. Mobile distributed tracing is enabled by default, so you should start seeing distributed tracing data once your agents are updated.
How to incorporate distributed traces with New Relic mobile monitoring
If you’re not already using New Relic mobile agents to monitor your mobile applications, follow these instructions to get set up with mobile distributed tracing:
1. Review the transition guide and distributed tracing documentation.
2. Deploy the latest mobile agent to your mobile applications.
3. After it is installed or updated, you should start seeing mobile distributed tracing data in New Relic One.
You can find the distributed tracing navigation tab when looking at an individual mobile application. (It’s on the left.)
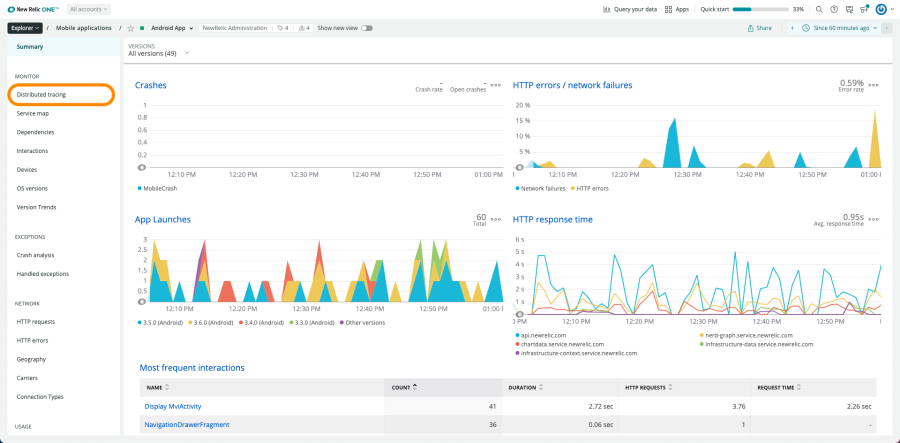
You can also access mobile traces by navigating to Browse Data > Traces and then in the Find traces where spans contain search field, enter mobileApp.name is not null. This filters all of the traces that originate from mobile spans.
Troubleshooting mobile performance with distributed tracing
Now that you have distributed tracing enabled for mobile, here’s how you can view those trace details to investigate performance issues.
- Navigate to view a mobile app via the Mobile tab.
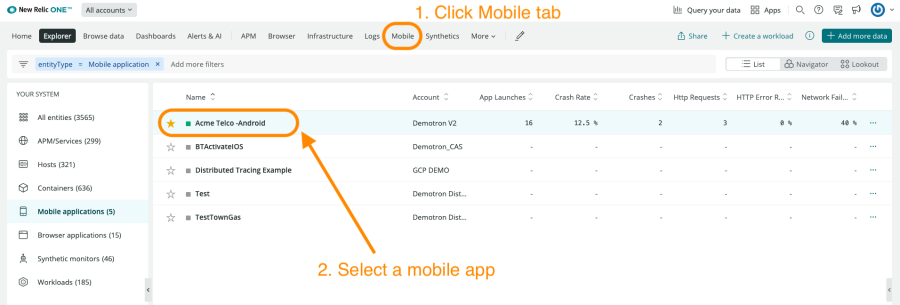
2. On the left navigation, select Distributed Tracing to see all trace groups originating in that mobile app.

3. Select the trace group you’re interested in. A window slides in that shows all the spans for that group.
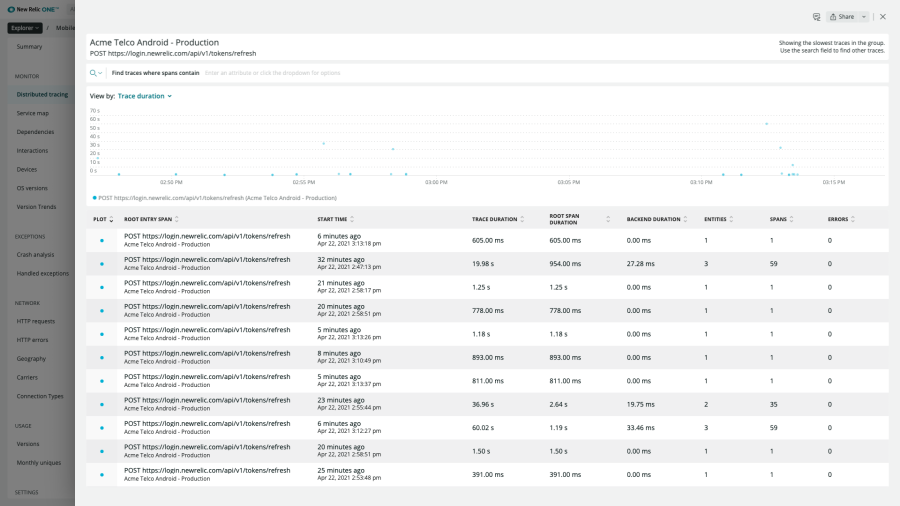
4. Select the specific trace you’re interested in. A window slides in that shows the backend spans supporting the service.
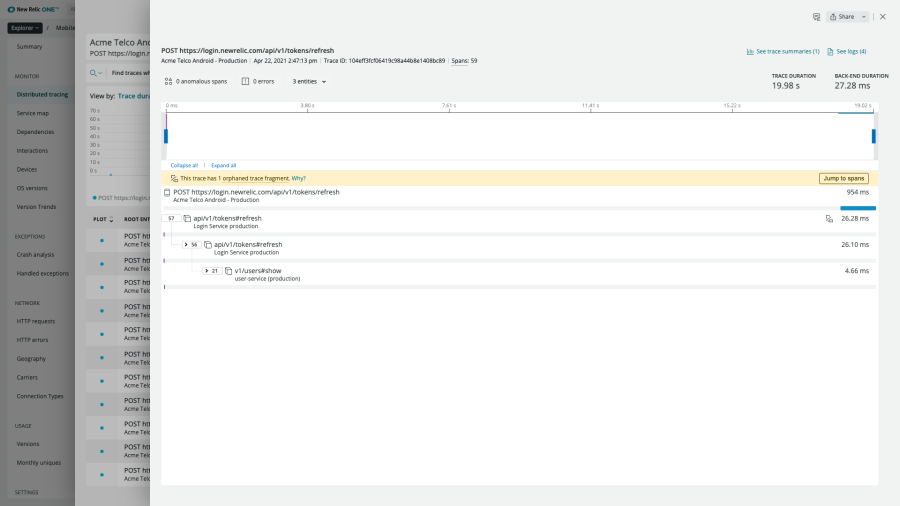
Note that when services aren’t instrumented, you won’t see data. If you see services that are not reporting data, follow these steps to get them instrumented.
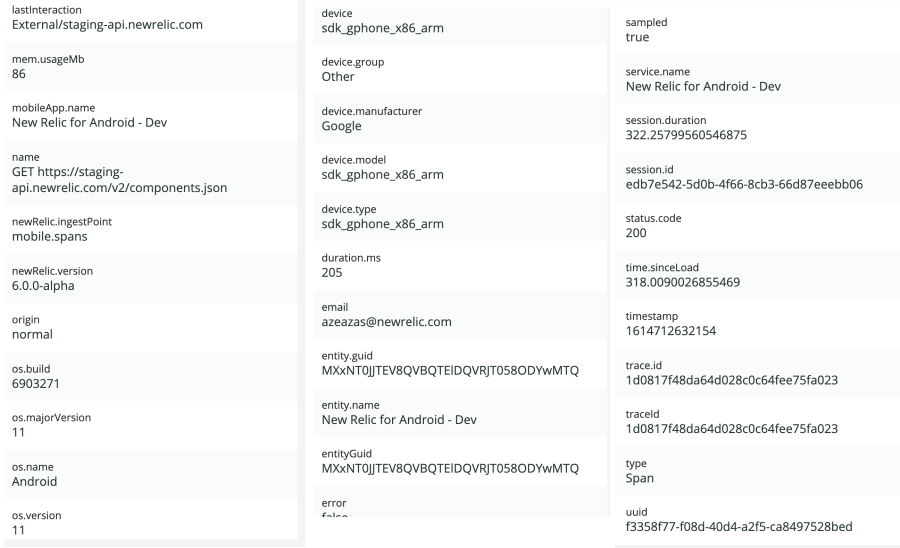
5. Select the mobile span (identified by the mobile icon) to see the attributes from the mobile request. This gives you a treasure trove of information about what the backend services are receiving from the front end.
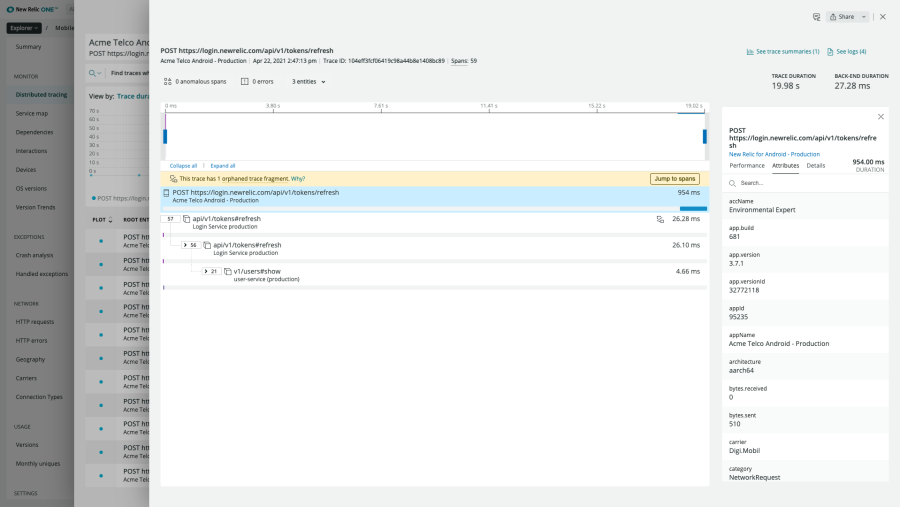
6. The mobile trace captures everything from the app name and version down to the specific device and user.
Étapes suivantes
Learn more about distributed tracing for mobile
There’s a lot more to learn about New Relic mobile monitoring with distributed tracing. Read our documentation, request a demo or sign up for a free trial today.
Les opinions exprimées sur ce blog sont celles de l'auteur et ne reflètent pas nécessairement celles de New Relic. Toutes les solutions proposées par l'auteur sont spécifiques à l'environnement et ne font pas partie des solutions commerciales ou du support proposés par New Relic. Veuillez nous rejoindre exclusivement sur l'Explorers Hub (discuss.newrelic.com) pour toute question et assistance concernant cet article de blog. Ce blog peut contenir des liens vers du contenu de sites tiers. En fournissant de tels liens, New Relic n'adopte, ne garantit, n'approuve ou n'approuve pas les informations, vues ou produits disponibles sur ces sites.


