Every day, operations teams managing modern software are dealing with complex systems, fragmented monitoring, and huge volumes of telemetry from many different tools. This scenario often involves poring through a variety of dashboards, screens, and logs, which creates added stress and anxiety for teams supporting such systems. Worst of all, it also usually results in unhappy users when teams are trying everything within their power to produce superior customer experiences.
Under these circumstances, reducing mean time to resolution (MTTR) remains critical but also seems more difficult than ever. In practice, the best way to cut MTTR is by improving MTTU (mean time to understanding). To do that, teams must not only move fast and isolate issues, but they also need added context and understanding to assess and comprehend the overall impact quickly.
So the question is no longer, “How is my database performing?” Rather, it’s, “How are all the things that make up my purchase process performing?”
To answer that type of question quickly, accurately, and easily, we’ve created Workloads in New Relic One. This feature is available for all New Relic One users today.
How workloads work in New Relic One
Our customers already have many excellent observability tools in the New Relic platform that help swiftly detect and troubleshoot problems, and extend far beyond simple, hand-built dashboards. The introduction of workloads builds on those capabilities, helping you quickly spot and isolate the causes of service degradation or an outage so that you can understand and resolve the incident fast.
What we call a “workload” is a group of entities that work together to provide a specific service. For instance, workloads may include a serverless application that includes an API gateway or a collection of Java microservices and the infrastructure they run on.
In New Relic Workloads, all the entities that combine to deliver a service are automatically grouped using your existing tags (e.g., multiple microservices, database, and storage). Additionally, a workload displays the most important signals specific to each entity type along with the overall health, all in one curated view for quick context and understanding.
When an incident arises, our connected, entity-centric platform allows users to quickly navigate from the high-level perspective to understand the ultimate impact and then zoom in on the low-level, troubleshooting tools.
And our customers are already finding significant value from Workloads.
"We are using Workloads in New Relic One to observe the load testing of a new product, and it’s great that I can see services and hosts from different sub-accounts together in context on one screen. I’m loving the feature," says a program manager for a US government agency. "With the metrics provided, it's easy to relate spikes from a group of services and to get out ahead on capacity planning."
Workloads—which can be set up in minutes—also takes advantage of New Relic’s tagging system and has the ability to query entities across accounts rapidly. This means that you can define a workload with rules that dynamically determine which entities belong to it. The result is less toil for teams and the assurance that you are looking at an accurate stack every time.
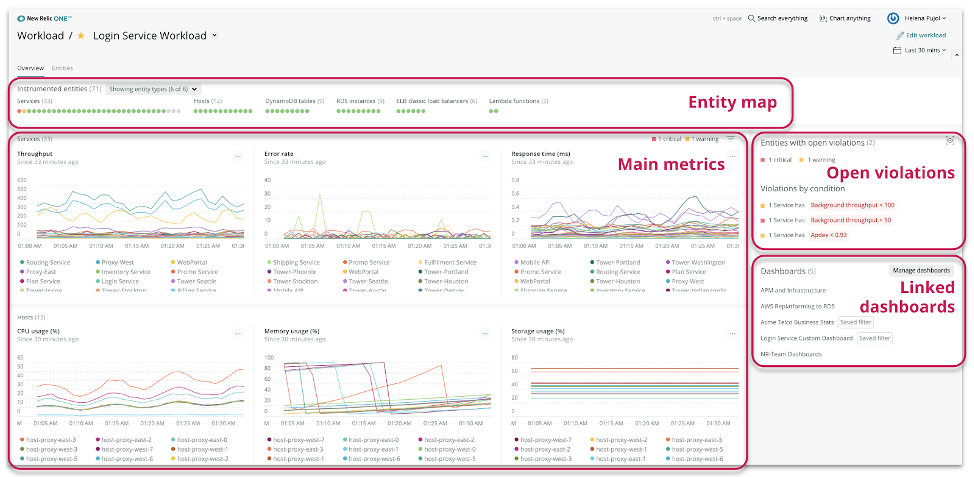
On the overview screen within New Relic One, you’ll see:
● Entity map: An overview of workload components, which is useful for understanding the workload’s architecture. The green, yellow, and red indicators quickly show you alert status for those entities.
● Main metrics: This includes charts with key metrics for each entity type—such as the number of requests, response time, and error rate for an application. Different entity types display different data. New Relic is being prescriptive by creating a consolidated view that shows users which metrics they need to check first for each entity type. Users can explore the charts to detect correlations among different entities (for example, two applications) and stack layers (for instance, applications and hosts).
● Open violations: A summary of the alerting entities, so you can know where to start troubleshooting.
● Linked dashboards: Users can link their custom dashboards from a workload, and create pre-filters that contextualize those dashboards.
Additionally, you can take advantage of the workloads API to automate the creation of workloads and modify their programmatically during deployments.
Operations teams need to understand and resolve incidents fast in their complex, dynamic systems. Workloads assists by helping your teams detect an issue quickly, isolate the source of problems, and begin troubleshooting. This means you’ll spend less time hunting and more time solving with workloads in New Relic One.
If you are already a New Relic One user, click on the Workloads tile to get started. If you aren’t a customer (yet!) and want to see how New Relic can help you find and fix issues faster, join one of our weekly online demos led by a solutions engineer. It'll be time well spent.
[embed]https://www.youtube.com/watch?v=5BHDdPhwljE[/embed]
Les opinions exprimées sur ce blog sont celles de l'auteur et ne reflètent pas nécessairement celles de New Relic. Toutes les solutions proposées par l'auteur sont spécifiques à l'environnement et ne font pas partie des solutions commerciales ou du support proposés par New Relic. Veuillez nous rejoindre exclusivement sur l'Explorers Hub (discuss.newrelic.com) pour toute question et assistance concernant cet article de blog. Ce blog peut contenir des liens vers du contenu de sites tiers. En fournissant de tels liens, New Relic n'adopte, ne garantit, n'approuve ou n'approuve pas les informations, vues ou produits disponibles sur ces sites.


