Smoke testing in production plays a vital role in ensuring seamless deployments. This article explores the significance of smoke testing, leveraging synthetic monitors for automation, and the key benefits of the continuous delivery pipeline.
Key takeaways:
- Smoke testing is essential for post-deployment verification in modern continuous delivery/continuous deployment (CI/CD) processes.
- Synthetic monitors offer automated solutions for testing performance, functionality, and availability in production environments.
- Custom dashboards and alert setups enhance visibility, enabling quick response to deployment issues.
Imagine you’re sitting on a plane flying across the country when the captain gets on the intercom and says, “Thanks for flying with us today, we’re just going to run a few tests now that we’re airborne. If you see smoke, please call a flight attendant.” Safe to say that scenario would make anyone nervous. While the stakes aren’t quite as high for software developers, testing in your production environment (if that’s your only testing) is very risky business. Just check out the many hilarious memes that illustrate the danger of testing in production, which is often called "smoke testing."
However, when paired with a robust pre-deployment testing process, smoke testing is a crucial part of a modern continuous delivery/continuous deployment (CI/CD) process. Continuous deployment is a big part of DevOps and modern web development, and integrating rapid and proactive testing can help teams confidently perform more deployments. Let’s take a closer look at smoke testing: why it’s used for web applications, the benefits smoke testing can give you, and how you can easily set up smoke testing using automated web -testing tools like synthetic monitors.
What is smoke testing?
Smoke testing is a basic level of software testing that is conducted to ensure that the most critical and important functionalities of a software application are working as expected. It involves running a quick set of tests on the latest version of the software, with minimal or no configuration, to check if it can be further tested.
Why is smoke testing crucial in web development?
Smoke testing ensures successful deployments by rapidly testing core functionality, reducing risks for end-users. Synthetic monitors automate this process, offering performance, functionality, and availability testing for reliable, continuous delivery.
Smoke test automation allows developers to run tests on demand or scheduled in parallel with other automated tests, allowing for faster feedback and quicker resolution of any issues. The quality assurance smoke tests are about running a series of fast and basic tests on the core functionality of your production environment (as well as other environments) to ensure deployments are successful and that you catch any major issues before end-users run into them. Smoke testing helps you save time and resources in the long run.
Types of smoke testing
There are several different types of smoke testing in software development:
Manual smoke testing
Manual smoke testing involves checking a software application's core functionalities, typically after new code changes or feature additions. This type of testing is usually carried out by a dedicated human team or tester who follows scripted test cases to ensure all key features are functioning as expected.
Automated smoke testing
As the name suggests, this type of smoke testing is performed automatically through the use of tools and scripts. It allows for faster and more efficient testing and the ability to catch any critical issues that may arise with each deployment. Automated smoke tests can also be integrated into continuous integration (CI) pipelines for even quicker results.
Hybrid smoke testing
Hybrid smoke testing is a blend of both manual and automated smoke testing, bringing human and computer together to cover all of the basics. With hybrid smoke testing, testers create the tests, prioritizing their efforts by focusing on more complex and critical features, and leave routine tests to be handled by automated scripts. This helps save time and resources while still ensuring thorough testing. With the right tools and processes, hybrid smoke testing can provide quick feedback on potential issues.
Ensure successful deployments with smoke testing
Smoke testing should take just a few minutes and, ideally, your tests should run in parallel, making them even faster. They should run immediately after new code or features are deployed to production and cover a broad range of core functionality.
Reporting on smoke testing over time can help teams understand whether they are pushing too hard to deploy new functionality and features at the expense of reliability and uptime, especially when combined with real user monitoring (RUM) and other observability analytics.
Smoke testing in production and staging
Smoke testing should be run during both production and staging. This helps ensure the application functions correctly in these real-world environments before being released to users.
Smoke testing in production involves running basic tests on the live environment to quickly identify any major issues or failures. This includes checking critical functionality such as login, navigation, and data retrieval. The goal of smoke testing in production is to catch any high-priority issues that could impact users and prevent them from using the application effectively.
Similarly, smoke testing in staging involves performing basic tests on a replica of the production environment. This allows for a more controlled testing environment for testing new features or updates before being deployed to production. It also helps identify any issues that may arise when moving from development to staging, allowing for quick resolution before deployment.
How to do smoke testing in production
Step 1: Define the scope and select test cases
Begin by clearly defining the scope of your smoke testing. Identify the critical features or functionalities that need to be tested in the production environment. Then, determine a number of test cases that cover the essential functionalities of your application or system. These should be basic scenarios that should work without major issues.
Step 2: Prepare the test environment
Ensure that your production environment is prepared for testing. It should be stable and, ideally, a clone of the actual production environment. If necessary, create or load test data that will be used during the smoke testing make sure the data is pertinent to the selected test cases.
Step 3: Execute smoke tests
Run the selected test cases in the production environment. These tests should be quick and focus on critical areas. Monitor the test results and check for any failures or issues.
Step 4: Document results
Document the results of the smoke testing. Be honest and straightforward about any issues or failures encountered during the testing.
Step 5: Investigate and communicate failures
If any failures occur, investigate them promptly. Determine whether the issues are related to the production environment, code changes, or configuration. Empower your team by communicating the findings of the smoke testing, and providing clear and concise information about any problems detected.
Step 6: Take corrective actions and re-test
If issues are identified, take immediate corrective actions to resolve them. This could involve rolling back changes, fixing code, or adjusting configurations. After addressing the issues, re-run the smoke tests to ensure the critical functionalities are working as expected.
Step 7: Final report
Prepare a final report that summarizes the smoke testing process, results, and actions taken. Be ingenious in identifying any patterns or insights that can improve future testing processes.
Step 8: Continuous improvement
In the spirit of innovation and openness, continuously improve your smoke testing process based on the lessons learned from each testing cycle.
Automate smoke testing in production with synthetic monitors
You can manually run smoke tests, but it’s easier and more reliable to automate the critical workflows you want to test. For example, if you have an eCommerce app, you might want to test that users can log in, check out, and connect to APIs via their mobile app. Fortunately, you can test this entire process with a synthetic monitor.
Synthetics is a powerful tool in the observability toolbox, but it’s easy to overlook when developers are focusing on application metrics, error rates, and logs. However, once you set up synthetic monitors, you can test on demand and on a regular basis, which improves your confidence in your deployments to production and, ultimately, improves your CI/CD pipelines.
Let’s take a look at several use cases where you can use synthetic monitors with New Relic Synthetics to perform smoke testing. You can also learn more about the different types of monitors from the video below.
Synthetic Monitor Types and What They Do
Testing performance
First, you’ll probably want to test if your latest deployment changed the performance of your website. With the simple browser monitor, which is a pre-built, scripted browser monitor, you can quickly set up a monitor that makes a request to your site using an instance of Google Chrome by just entering the URL you want to test.
It is always recommended to run these tests from at least three locations to ensure failed tests are not due to a localized connectivity issue. A fresh container runs simple browser tests each time, bypassing any caching and providing you with fast response times for benchmarking your RUM data.

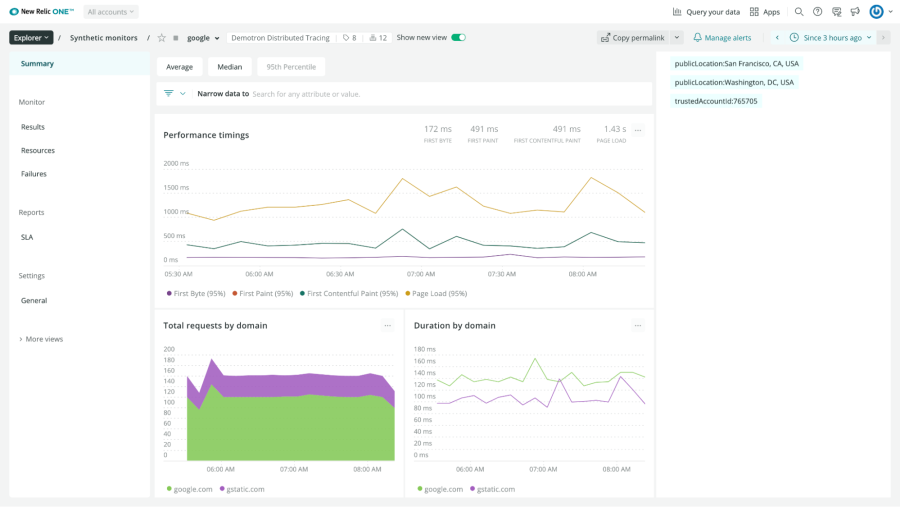
Test your site’s performance post-deployment with the simple browser monitor.
The scripted browser monitor also tests performance, but it takes a bit more configuration to set up and is more useful when testing user flows, which is described in the next section. By testing performance and capturing core web vitals, you can catch any pain points your users might experience such as slow page loads.
Testing functionality
After deployment, your smoke tests should ensure that key functionality in your application is working correctly. This includes user flows like logging in and interacting with your site, the status of links on your page, and the availability of backend services. New Relic has several options available to perform these tests.
Scripted browser monitor: Scripted browser monitors are used for more sophisticated, customized monitoring. You can create a custom script that navigates your website, takes specific actions, and ensures specific resources are present, like the checkout button on your eCommerce site. The monitor uses the Google Chrome browser. You can also use a variety of third-party modules to build your custom monitor.

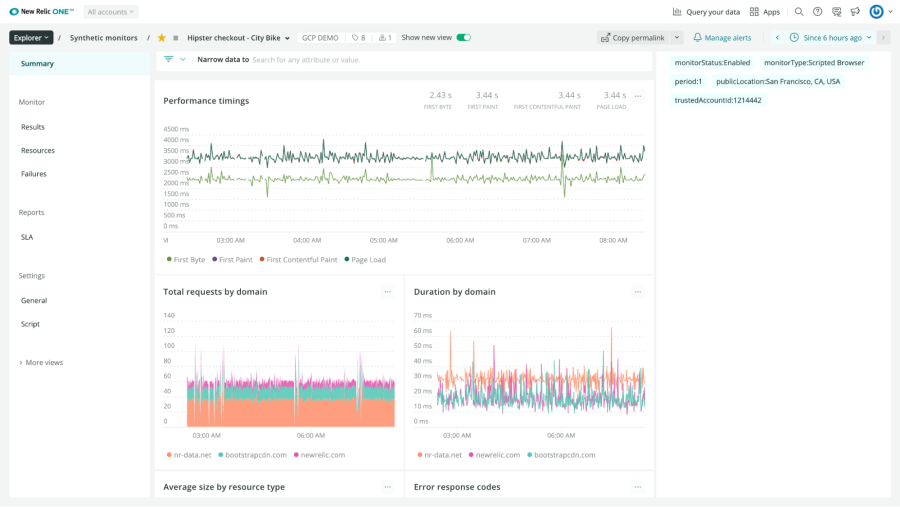
Test your web app’s performance and complex user flows with the scripted browser monitor.
Step monitor: This has the same functionality as the scripted browser monitor, but requires no code to set up. The monitor can be configured to:
- Navigate to a URL
- Type text
- Click an element
- Assert text
- Assert an element
- Secure a credential
Learn more about the step monitor here.
Scripted API monitor: API tests are used to monitor your API endpoints. This can ensure that your app server works in addition to your website. For example, if your mobile app makes calls to a backend service to pull product data, you would use this monitor. New Relic uses the HTTP-request module internally to make HTTP calls to your endpoint and validate the results.
Broken links monitor: You can also check your site for broken links. Provide a URL and this monitor will test all the links on the page. If any links fail, you can view these links individually.

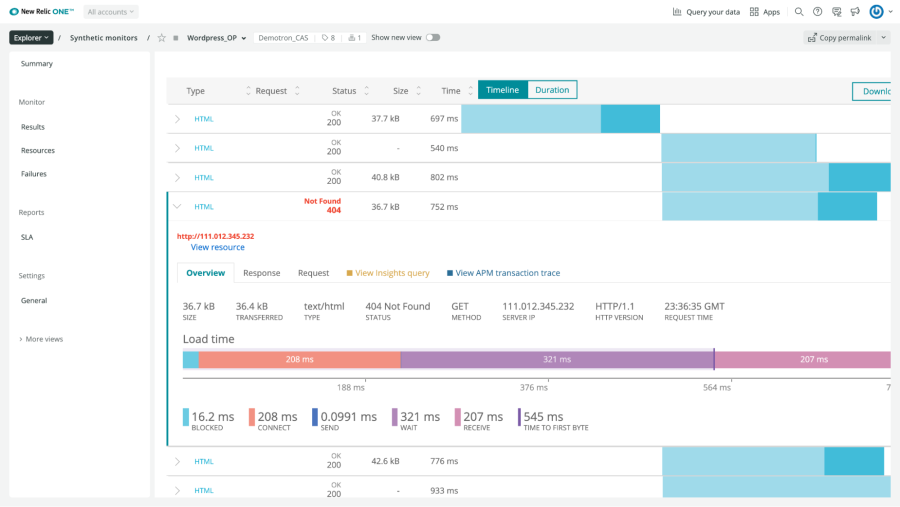
Quickly test for broken links on a page by simply providing a URL to the broken links monitor.
Testing for availability
Sometimes you just want to make sure that your app or site is available. With New Relic’s ping monitor, you can send a request to a URL and ensure that it returns a 200 response. You can run this type of monitor with high regularity and from multiple sites around the world, then view the difference in connection times based on the location. Note that this type of monitor is not an actual ping. The synthetic ping monitor uses a simple Java HTTP client to make requests to your site.

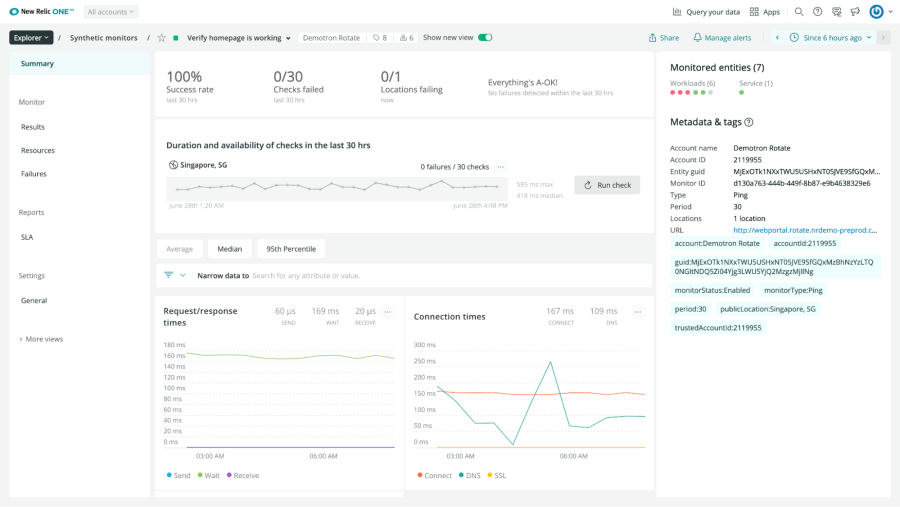
Test your site’s availability and connection speed with a ping monitor.
You can also use a monitor to check if your SSL certificate needs to be renewed. While monitoring your SSL certificate isn’t strictly related to smoke testing, you don’t want to scare users away with a “site is not secure” warning.
Use reports to fine-tune your deployments
One of the most powerful ways to improve DevOps processes is ensuring that the right teams and roles have access to reporting data in the form that makes the most sense for them. Tools like synthetic monitors immediately connect this test data with your other telemetry data and provide different ways to visualize that data.
Synthetics provides service-level agreement (SLA) reports at both the account level and at the individual test level. These reports show duration, uptime, and Apdex scores in daily, weekly, and monthly charts. These charts can easily be exported or shared directly with other platform users and external users who don’t have access to the platform. The image below demonstrates how to share a Daily SLA report with others.

Share a daily SLA report with external teams via a link.
Build a custom synthetic dashboard
You can also set up synthetic dashboards to get deeper visibility and understanding of how your tests and deployments are performing. Once smoke tests are running on a regular cadence, you can build performance data over time. This helps you track deployments and determine which ones are successful. In addition, you can measure each deployment’s impact on performance or business KPIs. This way, you can better understand whether you are effectively balancing the rate of deployments with service availability and stability.
To get started, use a Quickstart template to give you sample charts out of the box, or build your own dashboard with custom charts and NRQL queries. This allows your teams to see and share performance data in a more visual and interactive way.
If you build your own dashboard, you could plan it around two strands: success rates and performance. Here are some questions you can ask along with the NRQL queries that will give you the answers you need.
What is the success rate of individual monitors?
SELECT percentage(count(result), WHERE result = 'SUCCESS') AS 'Success Rate' FROM SyntheticCheck WHERE monitorName = 'Your Test Name' SINCE 1 week ago
Which monitors are failing and why? Which locations are failing and why?
SELECT count(result) FROM SyntheticCheck FACET error
SELECT count(result) FROM SyntheticCheck WHERE result != 'SUCCESS' FACET locationLabel, error
What’s the benchmark performance and timing of tests from different locations?
SELECT average(duration) FROM SyntheticCheck FACET locationLabel
Use alerts to quickly respond to deployment issues
Finally, you should add alert conditions to notify your teams before your users run into deployment issues. For example, you can set up alerts so you’re notified when any of your tests fail. You can also add alert conditions that trigger when the overall success rate of monitors drops below your SLO’s, or if the performance of any of your tests drops below the acceptable baseline levels that you specify. Read more about New Relic alerts here.
Conclusion
Smoke testing in production is crucial for ensuring a smooth user experience, reducing risks and downtime, validating new updates, and improving overall software quality. It should be an essential part of any organization's deployment process to deliver reliable and high-performing software to their customers.
Étapes suivantes
Start using New Relic Synthetics to perform smoke testing today. Watch this demo video or read our documentation.
We also have an upcoming webinar where you can get hands-on experience setting up synthetic monitors. Sign up here.
If you’re not already a New Relic customer, then request a demo or sign up for a free trial today.
Les opinions exprimées sur ce blog sont celles de l'auteur et ne reflètent pas nécessairement celles de New Relic. Toutes les solutions proposées par l'auteur sont spécifiques à l'environnement et ne font pas partie des solutions commerciales ou du support proposés par New Relic. Veuillez nous rejoindre exclusivement sur l'Explorers Hub (discuss.newrelic.com) pour toute question et assistance concernant cet article de blog. Ce blog peut contenir des liens vers du contenu de sites tiers. En fournissant de tels liens, New Relic n'adopte, ne garantit, n'approuve ou n'approuve pas les informations, vues ou produits disponibles sur ces sites.


