Imagine it’s Black Friday, and your Twitter feed is blowing up with customers saying your website is slow and they're unable to add items to their cart. Luckily, you think, you’ve configured your monitoring tool to detect and alert you when excessive 504 errors occur. But as you attempt to investigate the cause of your issues, you realize that you’re stuck: Your metrics lack the details you need to isolate the problem from the vast number of related factors that could be causing the errors. Panic sets in when you realize that simply monitoring a set of metrics is insufficient. And, without high-cardinality data, you lack observability to detect, isolate, and mitigate the underlying issues impacting your site.
Observability vs. monitoring
The term monitoring has taken a beating recently, with vendors jumping over each other to position themselves as observability instead of mere monitoring providers. But we see this as a false choice; monitoring some key metrics with dashboards and alerts is one part of a holistic observability strategy. But observability requires much more.
As What is observability? explains, monitoring tells you when something is wrong. You need to know in advance what signals you want to monitor (your “known unknowns”). On the other hand, observability is the condition of being empowered to ask why, giving you the flexibility to dig into “unknown unknowns” on the fly.
In today’s world of complex, distributed systems built on thousands of microservices, predicting all failure modes becomes impossible, so you need the flexibility to ask any question of your data to solve complex problems.
What is cardinality?
As mentioned, monitoring important aggregate signals (i.e., metrics) is one important element of keeping your stack running smoothly. That’s why we enable companies to send dimensional metrics to our New Relic platform from virtually any third-party monitoring tool, such as Prometheus, Telegraf, and more. These metrics provide important signals about the overall health and performance of myriad systems. However, they also involve trade-offs, which we’ll discuss shortly.
But first, let’s understand two key concepts:
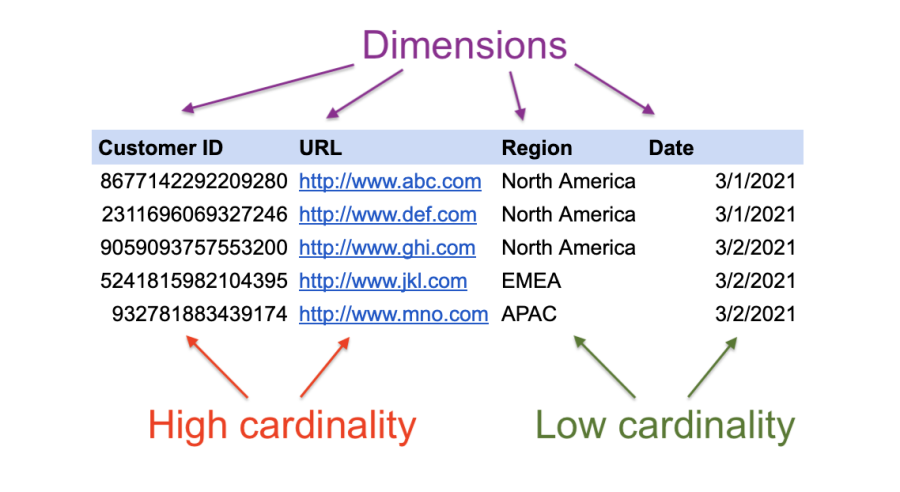
- Data dimensions: A set of data attributes pertaining to items of interest to your business—think “customers,” “products,” “stores,” and “time.” Data dimensions are numeric facts (about anything) that you want to monitor—such as
CustomerID,URL,Region,Date—essentially the ‘keys’ in key:value pairs. - Cardinality: The number of unique values within a data dimension (the intersection of ‘keys’ and ‘values’). Thus,
Regionrepresents low-cardinality data, whereasCustomerID(each of which is unique) represents high-cardinality data.

Low-cardinality data, often represented by dimensional metric data, has limitations. Metrics employ functions such as count, sum, min, max, average, and latest. As implied by each function name, these data points are summarized data about individual events or sample transactions. Examples include:
maxCPU usage per minuteaveragenumber of transactions per hourcountof 504 errors per second
Simply knowing the count of 504 errors doesn’t tell you why you have those errors. To overcome this limitation, you can add tags (dimensions) to the data, each of which serves to increase the cardinality of the data (thus, making your data more useful for troubleshooting).
What limits cardinality
Naturally, everybody would love their monitoring and observability tools to record every transaction across their entire stack, each one augmented with a limitless number of key:value pairs, enabling users to correlate errors and root causes. But here’s the problem: Most monitoring tools can’t support high-cardinality data.
As cardinality increases, the volume of data increases, requiring a ton of compute and storage to process this data quickly and efficiently. The unfortunate reality is that most tools aren’t powerful enough to scale to meet these demands. Incredibly, some tools don’t even bother allowing you to query your data ad hoc.
For example, one SaaS monitoring vendor requires you to pre-identify the data you want to facet at ingest time, because they’re incapable of scaling at query time. Not only does this architecture slow their ingestion pipeline (and your time to understand why), it completely limits your ability to query your data in an ad hoc manner.
As a result of the limitations above, you’re stuck with one or more of the following:
- Severe limits on the number of dimensions you can add
- Sampled or aggregated data
- Reduced storage duration
- Punitive costs for exceeding a (way too low) strict limit on the number of tags allowed
In summary, you’re left only with monitoring, the ability to identify a problem but without the data granularity to identify and remediate the root cause.
What cardinality requires
Low-cardinality data and monitoring can help you detect problems. Still, you need high-cardinality data to understand which customers (or hosts, App IDs, processes, and SQL queries) are correlated to an issue. High-cardinality data provides the necessary granularity and precision to isolate and identify the root cause, enabling you to pinpoint where and why an issue has occurred.
Long before the term observability entered the industry lexicon, New Relic’s platform was focused on high-cardinality data, supporting discrete, detailed records, such as application transactions and browser page views. For example, imagine customers placing orders on a website. The New Relic data model enables you to record the userID, the dollar amount, the number of items bought, the processing time, and any other desired attributes for every single transaction. And New Relic is schemaless, so you don’t need to know in advance every dimension you’ll want to include for any given transaction.
As your business evolves and introduces new types of transactions with different parameters, simply add them for those transactions. Such granular data lets you investigate individual transactions, going beyond the capabilities of low-cardinality, aggregated metrics. You may want to ask:
- Show me all users who experienced a 504 error today between 9:30-10:30 a.m.
- Were they spread out over all hosts, or just some?
- What services were they accessing?
- What database calls were being made?
- Were they trying to purchase particular products?
Ask the unknown unknowns
Because each transaction is a discrete event, you can analyze any given attribute’s distributions, including the correlation between attributes. No longer do you need to identify every question you’ll need to ask in advance, getting stuck when your pre-built dashboards don’t address your most recent issue.
NRQL, New Relic’s SQL-like query language, empowers you to interrogate your data in real time, asking any question of your data, even those you hadn’t thought you would need to ask. And by combining all of your telemetry data—metrics, events, logs, and traces—in a unified platform, you get a complete view of your entire technology stack. You can traverse all of your telemetry data across common dimensions when investigating performance issues.
To empower you with these unique capabilities, we built the world’s most powerful telemetry data platform. It’s designed specifically to handle high-cardinality data. The New Relic platform runs on a large distributed system—a multi-tenant cloud service—where queries run on thousands of CPU cores concurrently, and process billions of records among petabytes of data in seconds, giving you answers in milliseconds.
And there’s no need to worry about tags blowing up your bill. Our industry-leading $0.40/GB of data ingested gives you predictability and the confidence to know that your data will be right at your fingertips when you need it.
Étapes suivantes
If you’re not using New Relic yet, sign up for a free account today.
Les opinions exprimées sur ce blog sont celles de l'auteur et ne reflètent pas nécessairement celles de New Relic. Toutes les solutions proposées par l'auteur sont spécifiques à l'environnement et ne font pas partie des solutions commerciales ou du support proposés par New Relic. Veuillez nous rejoindre exclusivement sur l'Explorers Hub (discuss.newrelic.com) pour toute question et assistance concernant cet article de blog. Ce blog peut contenir des liens vers du contenu de sites tiers. En fournissant de tels liens, New Relic n'adopte, ne garantit, n'approuve ou n'approuve pas les informations, vues ou produits disponibles sur ces sites.


