Change is often a main indicator of a problem. Continuous integration (CI) and continuous delivery (CD) lead to constant change and innovation, which helps you build quickly but can open up your organization to greater reliability risks. Change tracking in your observability platform allows both development and business teams to share context around real-time deployments and fix problems faster. With this knowledge, you can improve CI/CD processes over time to decrease your deployment time and reduce the number of outages that occur.
CI/CD has become the standard in software development and IT operations. Whether your team is fully cloud-native or you’re still managing on-premises infrastructure, today’s software delivery landscape requires speed. CI/CD applies to all types of businesses and environments, allowing you to deliver reliable software to your customers faster.
Release managers know CI refers to the process where code is regularly built, tested, and merged into a shared repository. CD processes ensure that it takes minimal effort to deploy new code, automating much of the bug testing and handoff of deployment responsibilities between product teams, developers, and operations teams. To be a successful release manager, you’ll take charge of automating CI/CD practices and implementing ways to track changes and share deployment context across disparate teams.
Connecting CI/CD to your observability environment
Seamlessly tying CI/CD into observability practices gives you more insights into your product and capability performance and usage, driving even faster iterations of your CI/CD pipeline. Here at New Relic, we know how to help you build observable systems.
Both developers and operations teams can quickly share context around testing, deployments, config changes, business events, and more to ensure continuous delivery doesn’t lead to downtime. And, when an error or an incident occurs, CI/CD metadata is shared across your observability architecture, giving critical details to a problem’s first responder. Observability can help you balance uptime and reliability with the speed required to keep up with today’s software delivery velocity.
Change tracking for release managers
As a release manager, you can simply integrate your CI/CD toolchain with New Relic to track your production environment’s performance. When you deploy, you can easily see how each deployment affects applications, infrastructure, networks, and more. You can integrate New Relic with tools such as GitHub and Jenkins to automate the process of sharing deployment details on top of performance charts and tables all across the New Relic platform. A new GraphQL API and updates to the New Relic CLI allow you to easily mark any kind of change (such as a deployment, config change, or business event) on top of observability data.
Integrating your CI/CD toolchain with New Relic
New Relic helps you get insights from your CI/CD toolchain to not only improve the operational efficiency of your development and operations teams but ultimately drive greater efficiency for your overall business. If you’re a developer, an IT practitioner, or a business team who needs to get insights from your CI/CD toolchain to reduce operational costs, increase efficiency, and drive more reliable customer experiences, check out our unified observability platform.
Here are a few examples of CI/CD tools you can connect to New Relic to optimize your CI/CD pipeline and track changes across teams, all part of the 550+ integrations with New Relic.
Jenkins
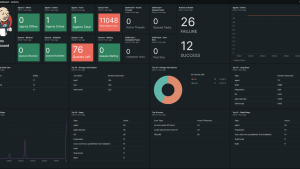
Use the Jenkins quickstart integration to monitor Jenkins CI/CD activity, jobs, and pipeline executions with the OpenTelemetry plugin. Automatically mark charts with deployment details and see those deployments in context with errors, logs, traces, incidents, and more. These details allow you to correlate deployments with shifts in golden signals, log attributes, and other important metrics. To learn how to configure the plugin, see our documentation for tracking changes using Jenkins.
GitHub
- With the GitHub for CodeStream quickstart integration, you can create, review, and merge GitHub pull requests without ever leaving your IDE, using the power of New Relic CodeStream. This integration includes full source-tree and file level access, your favorite keybindings, and all the code intelligence embedded in your development environment. To learn how to connect CodeStream to GitHub, see the CodeStream documentation.
- With our GitHub Actions integration, you can overlay deployment details on top of your golden signals across New Relic. Release managers can automatically share context when deployments are made, leading to faster response when incidents occur and ultimately driving faster CI/CD pipelines.
CircleCI
With the CircleCI quickstart integration, you get visibility into the performance and health of your CircleCI jobs so you can monitor real-time CI performance, activity, and pipeline health—and identify opportunities for optimization.
Netlify Builds
The Netlify Builds quickstart integration visualizes your Netlify performance with a wide selection of pre-built dashboards for a detailed view of your web application traffic. This includes page views, load times, sessions, and most popular content.
Using Netlify with New Relic can help you better understand website visitors, where they’re from, what devices they’re using, and more. Detailed information such as page load speed and the largest contentful paint can help you drive web improvements. You can also see all JavaScript errors tagged by deployment and compare deployment statistics to notice trends around failed builds.
Speedscale
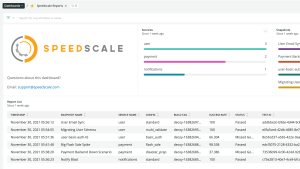
Use the Speedscale quickstart integration to track golden signals such as latency, throughput, CPU, memory, and error metrics before you deploy. Speedscale allows you to preview your container or API behavior in your CI pipeline without having to write any scripts.
Speedscale Snapshots are subsets of traffic that you would like to replay to test how your new code reacts, similar to test scenarios. Deploying the New Relic Speedscale quickstart adds a dashboard in New Relic that includes replay success rates, response times, and deep links to reports.
Étapes suivantes
Get started by reading more about change tracking with New Relic and looking at our 550+ instant observability quickstarts to ensure full-stack observability across your entire toolchain.
If you're not already using New Relic, sign up for a free account. Your account includes 100 GB/month of free data ingest, one free full-platform user, and unlimited free basic users.
Les opinions exprimées sur ce blog sont celles de l'auteur et ne reflètent pas nécessairement celles de New Relic. Toutes les solutions proposées par l'auteur sont spécifiques à l'environnement et ne font pas partie des solutions commerciales ou du support proposés par New Relic. Veuillez nous rejoindre exclusivement sur l'Explorers Hub (discuss.newrelic.com) pour toute question et assistance concernant cet article de blog. Ce blog peut contenir des liens vers du contenu de sites tiers. En fournissant de tels liens, New Relic n'adopte, ne garantit, n'approuve ou n'approuve pas les informations, vues ou produits disponibles sur ces sites.


