A new season represents a time for change. As we reflect on the past few months at New Relic, we’ve had quite a few changes of our own. In July, we simplified our pricing model and reimagined New Relic One. Since then, we’ve released 40+ new features, capabilities, and integrations to help you deliver value to your customers.
To recap this season, we’ve asked our engineers and product managers to list their favorite features to help you be more productive and collaborative.
Here are their top 10 picks:
1. Dark mode
When you're resolving incidents in the middle of the night or want to avoid straining your eyes, you can view New Relic One in dark mode. Dark mode is way more than just a cool feature (though it still is that). For many industries, dark mode is essential. Learn more here.
2. New AWS integrations
Get end-to-end visibility into your AWS cloud services and the rest of your stack with valuable new integrations:
- AWS Lambda Extensions substantially ease your ability to send telemetry data from AWS Lambda to New Relic One.
- AWS Control Tower automatically integrates with New Relic One for single or multi-account environments enrolled in AWS Control Tower.
- AWS Distro for OpenTelemetry uses the OpenTelemetry Collector and New Relic exporter to send telemetry data from your AWS services to New Relic One.
- AWS X-Ray Integration automatically combines traces from AWS managed services with traces from New Relic for end-to-end observability visualized entirely within New Relic One. You can capture, filter, and query it all—no manual instrumentation required.
- Amazon Kinesis Data Firehouse helps you ingest and forward CloudWatch Logs data into New Relic One to expand the insights into your cloud stack.
- AWS Bottlerocket helps provide full visibility into workloads and infrastructure, including Amazon EKS and Amazon ECS in New Relic One.
New Relic also achieved AWS Outposts Ready Designation, which recognizes that New Relic One offers complete visibility into AWS compute, storage, database, and a full range of other available AWS services in the AWS regions.
If you build, deploy, or maintain apps and critical workloads on AWS, you can now get full, instant access to all of New Relic One for free, and only pay for what you use beyond 100 GB per month when you subscribe to New Relic in the AWS Marketplace.
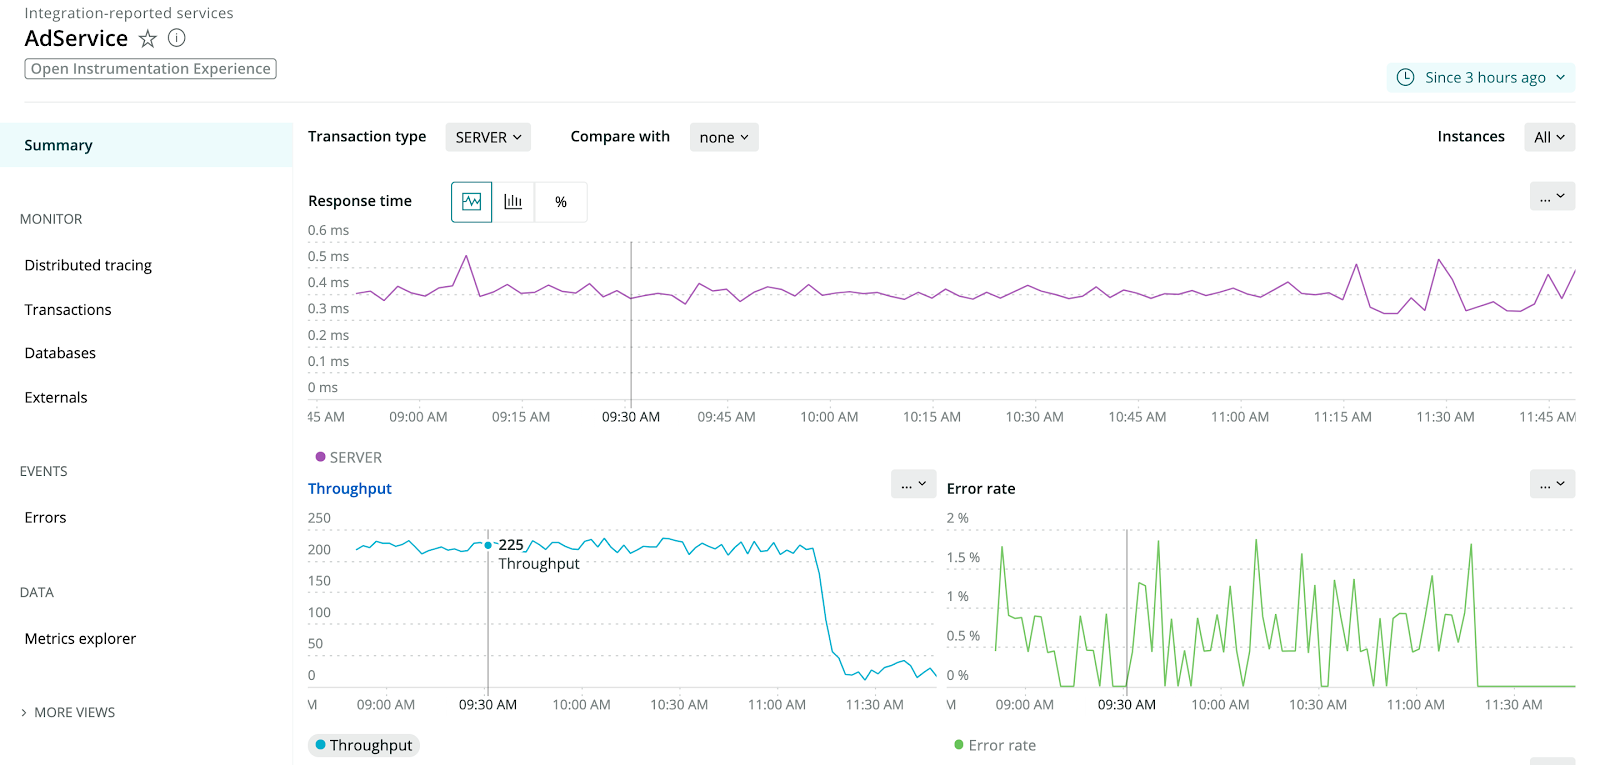
3. OpenTelemetry UI
New Relic One now has a UI dedicated to providing full APM functionality for your OpenTelemetry data. Send your OpenTelemetry data to New Relic using one of the OpenTelemetry exporters and quickly discover and analyze your data to optimize the performance of your applications and services using one of seven key pages. Learn more here.
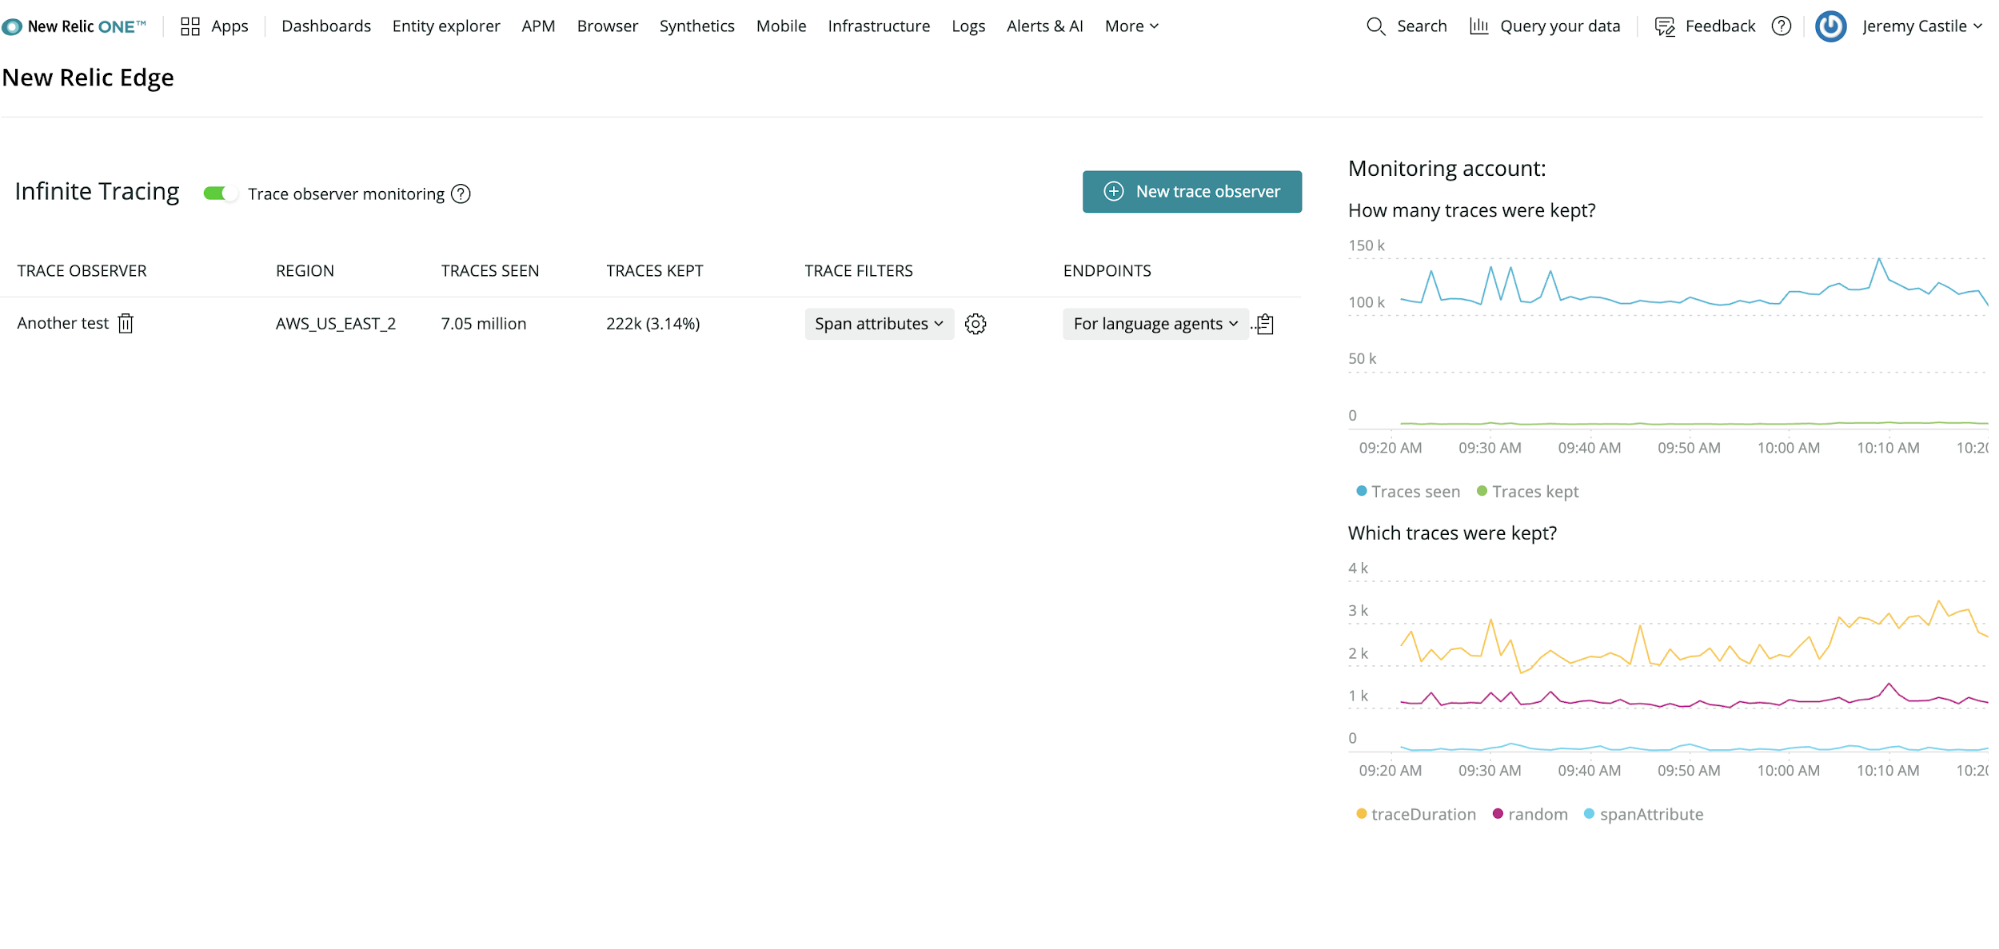
4. New Relic Edge with Infinite Tracing
New Relic users with Pro or Enterprise Full-Stack Observability can now access and benefit from New Relic Edge with a fully managed, cloud-native, tail-based distributed tracing service. This new service observes 100% of all application traces across your distributed systems, and provides visualization and storage for the most actionable data so you can investigate and solve issues faster. Learn more here.
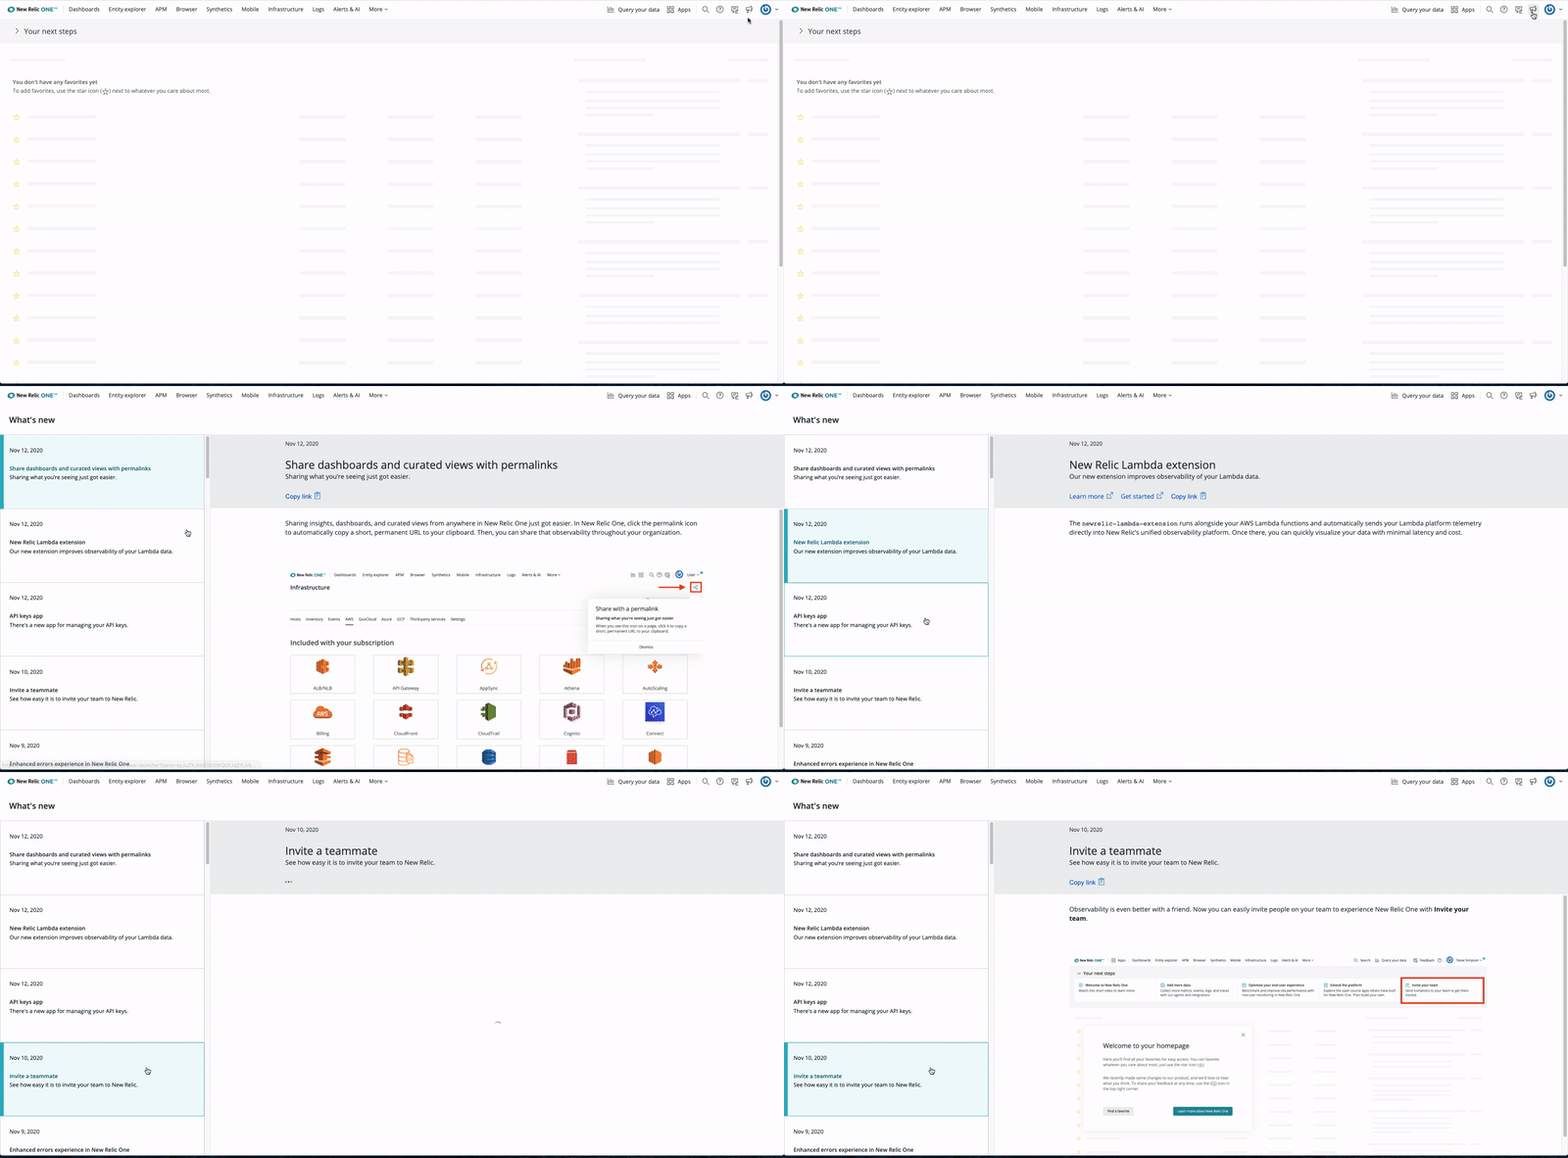
5. What’s new
When there are product updates, New Relic One notifies you and directs you to "What’s new"—your in-product destination to learn more about what we’ve released. There, you will find posts for each new feature with a brief description, resources, tips-and-tricks, and best practices to ensure you are productively leveraging the latest innovations and getting the most out of New Relic One. Learn more here.
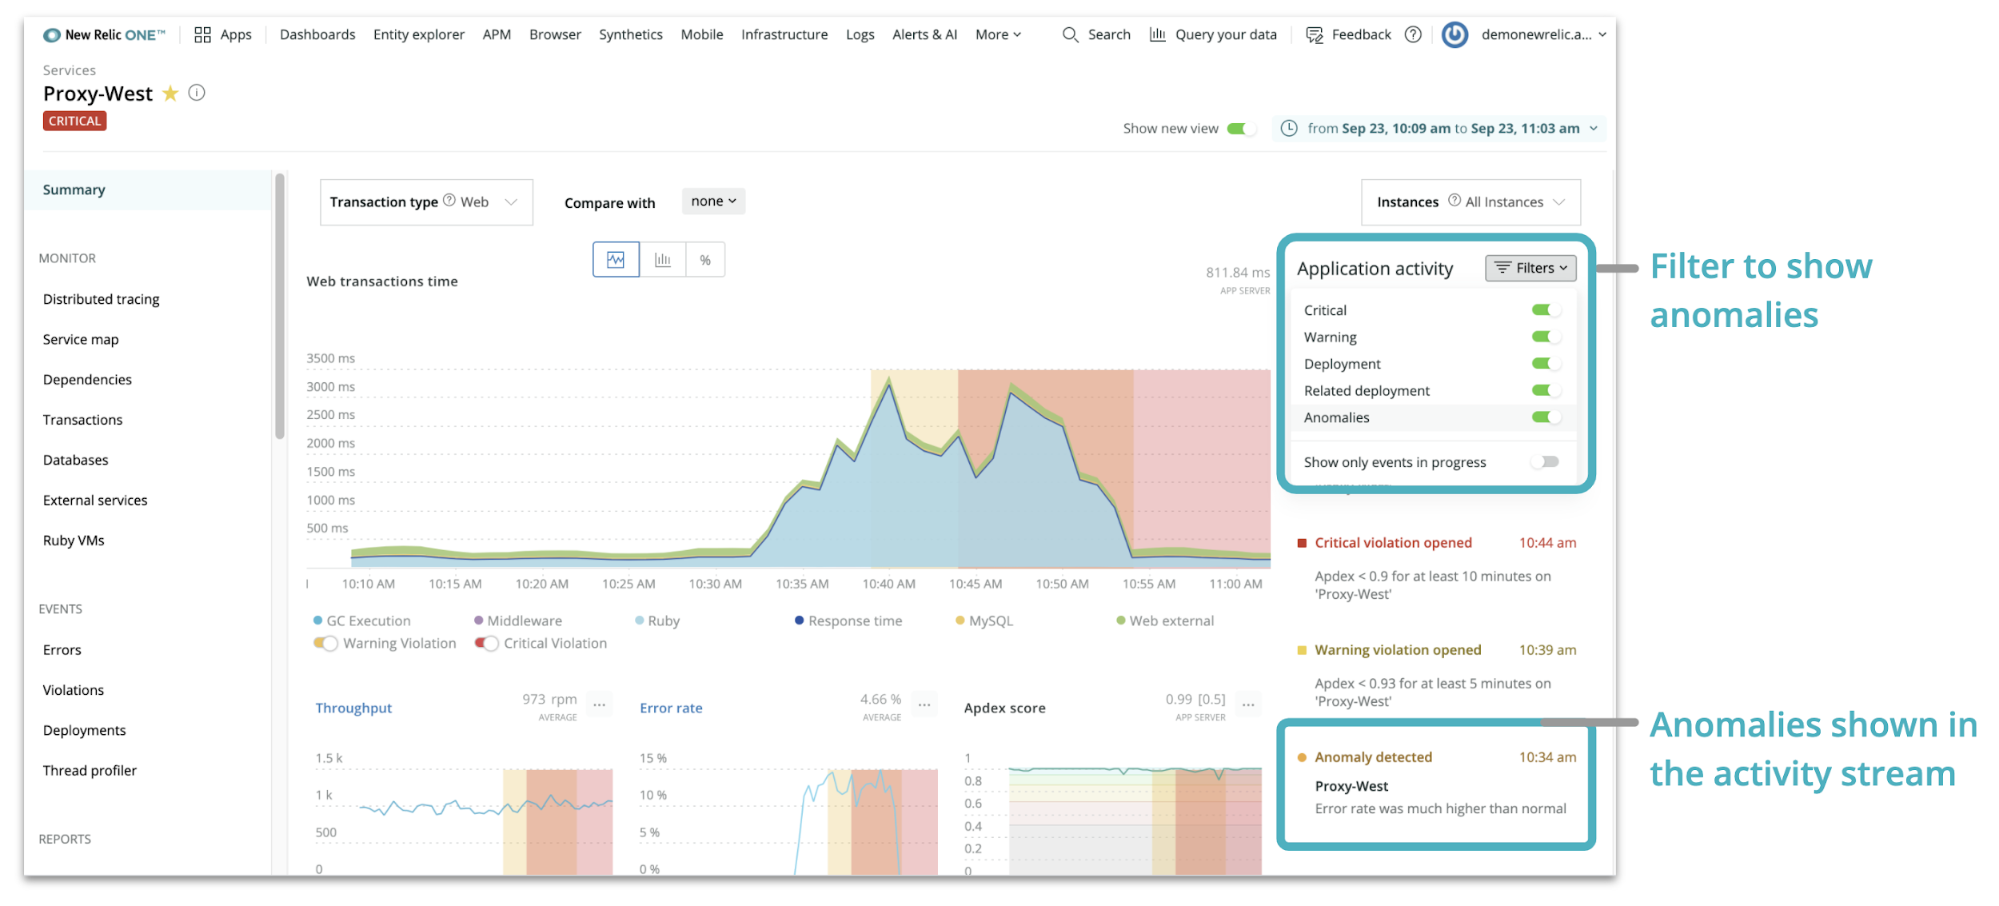
6. Anomalies visible in the activity stream
You can now view anomalies with the activity stream, which is visible from the New Relic One homepage, APM summary page, and APM list page. The activity stream displays recent events from alerts and deployments and provides a direct view into what has changed in your system so that you can fix outages quickly. Learn more here.
7. Kafka Connect
Unlock open source and alternative instrumentation sources by ingesting data from Apache Kafka topics into New Relic One, without writing a single line of code, with the New Relic connector for Kafka Connect. Learn more here.

8. Windows support for logs
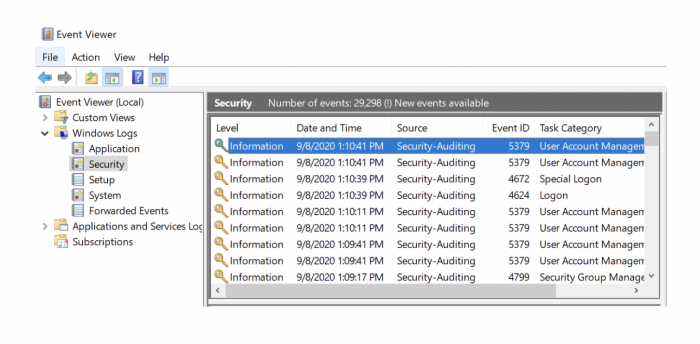
You can now send all of your logs to New Relic using the infrastructure agent in Windows. This feature includes new filters to select exactly which log types (application, security, or system) and messages you are interested in, all the way down to the EventID. Learn more here.
9. Share with permalink
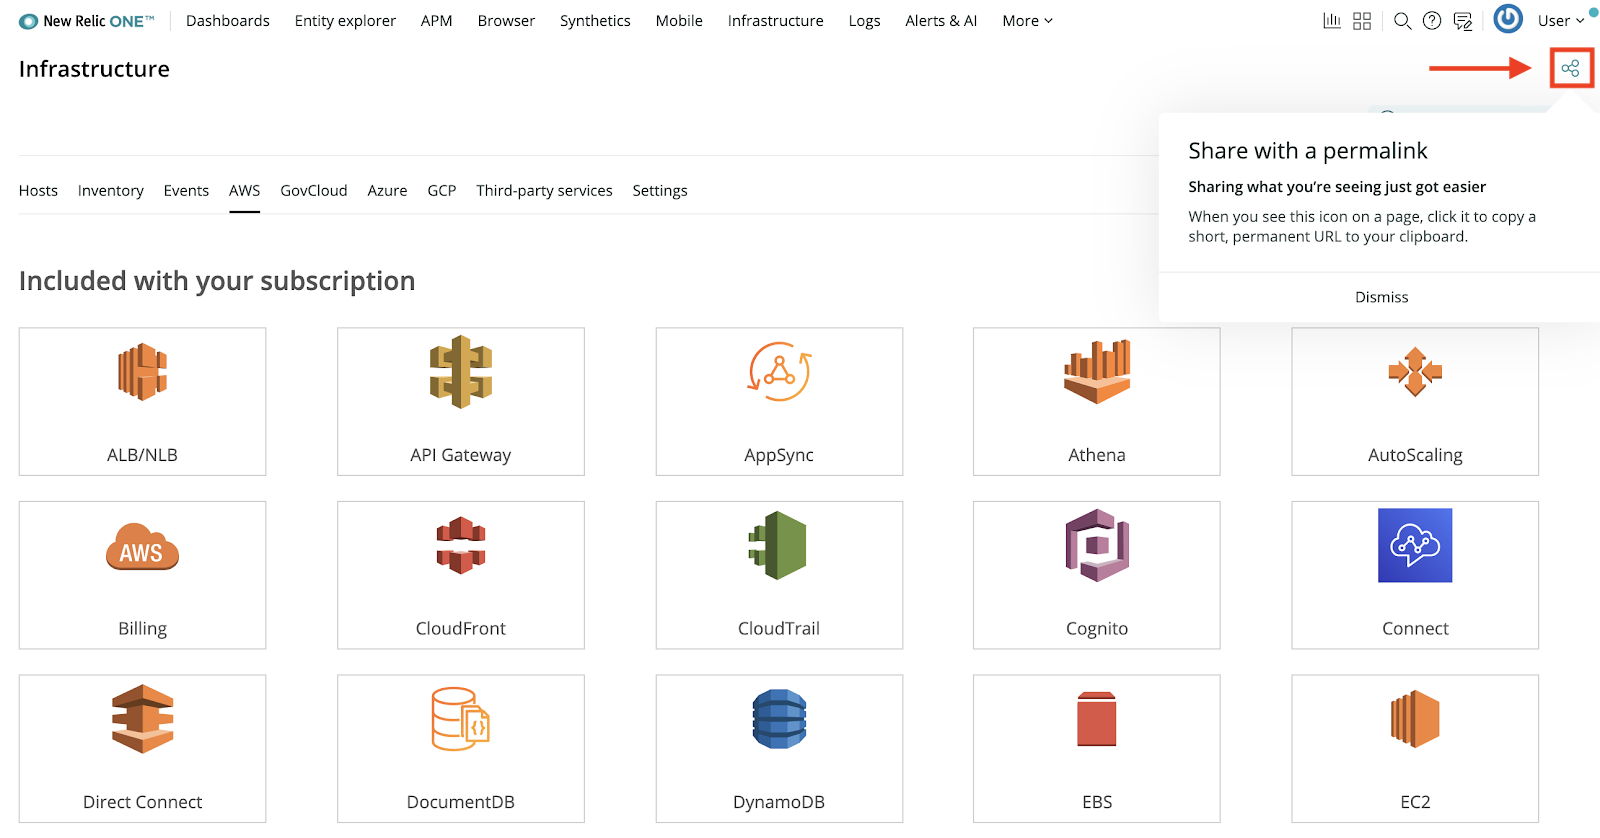
Share insights, dashboards, and curated views from anywhere in New Relic One by clicking the permalink icon to copy a short, permanent URL to your clipboard automatically. Learn more here.
10. Scheduled alert muting
Now you can schedule when you want to mute alerts to avoid messages during maintenance or deployments. Learn more here.

11. Bonus! Observability for Good
At our Nerd Days 1.0 event, New Relic introduced a new partnership with Code for America and announced The Observability for Good Program, a new product donation program designed to help NGOs, nonprofits, and charities worldwide leverage the benefits of observability to advance their missions. Eligible organizations get:
- 1TB of free data ingest per month in the Telemetry Data Platform
- Up to 5 free standard users with access to Full-Stack Observability
- 50% discount on Applied Intelligence
- Additional platform discounts for use beyond the free tier
- Access to ticketed support services
- Access to NewRelic.org programs, such as our pro bono program, where New Relic employees will volunteer to help not-for-profit customers with scoped technical projects to ensure optimal use of New Relic One
To check out the top 10 features and more in New Relic One, login and click the megaphone icon on the New Relic One homepage, or head to the What’s New docs page.
Las opiniones expresadas en este blog son las del autor y no reflejan necesariamente las opiniones de New Relic. Todas las soluciones ofrecidas por el autor son específicas del entorno y no forman parte de las soluciones comerciales o el soporte ofrecido por New Relic. Únase a nosotros exclusivamente en Explorers Hub ( discus.newrelic.com ) para preguntas y asistencia relacionada con esta publicación de blog. Este blog puede contener enlaces a contenido de sitios de terceros. Al proporcionar dichos enlaces, New Relic no adopta, garantiza, aprueba ni respalda la información, las vistas o los productos disponibles en dichos sitios.


