Performance engineering and load testing are critical parts of any modern software organization’s toolset. In fact, it’s increasingly common to see companies field dedicated load testing teams and environments—and many companies that don’t have such processes in place are quickly evolving in that direction.
Driven by key performance indicators (KPIs), performance engineering and load testing for software applications have three main goals:
- To prove the current capacity of the application
- To identify limiting bottlenecks in the application’s code, software configurations, or hardware resources
- To increase the application’s scalability to a target workload
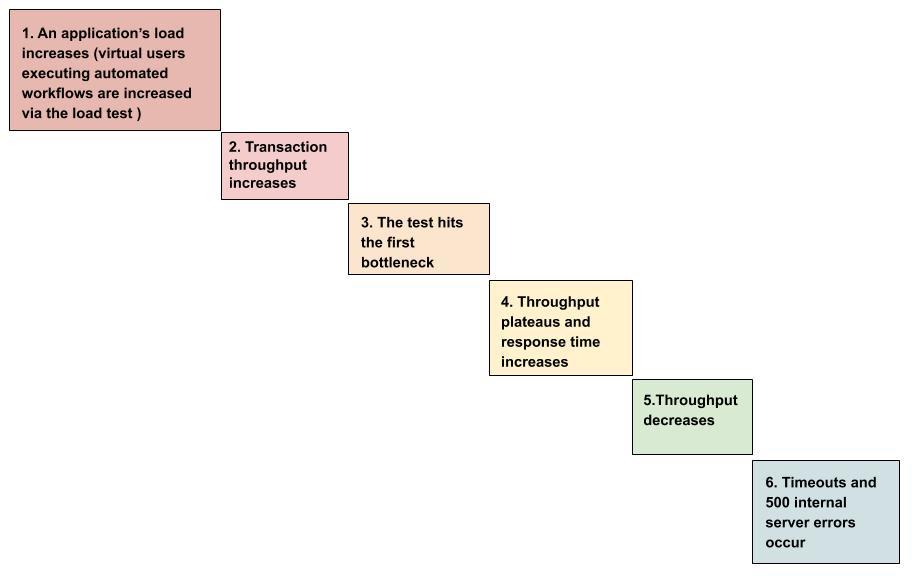
More specifically, a typical load test might look like this:
While there are plenty of tools available for generating the user load for a performance test, the New Relic platform (particularly New Relic APM 360, New Relic Infrastructure, and New Relic Browser) provides in-depth monitoring and features that can give crucial insights into the analysis of such tests—from browser response times to user sessions to application speed to utilization of backend resources. Teams that instrument their load testing environments with New Relic get complete end-to-end visibility into the performance of their applications.
This blog post presents a prescriptive 12-step overview (divided into 3 parts) of how to use New Relic for methodical load testing and root-cause analysis in your performance engineering process.
Part 1: Set a baseline and identify current capacity
The first step is to set up a load test and slowly increase the load until your application reaches a bottleneck.
1. Starting with a minimum user load (for example, 5 concurrent users), execute a load test that lasts at least 1 hour. The result of this low load test will serve as your baseline.
Pro tip: If the results of your baseline load test show that transactions exceed your service level agreements (SLAs), there’s no reason to further test for scalability. You can proceed to the next step.
2. Using the baseline load test results, set an acceptable Apdex score for your application. The Apdex will be your gauge for the average response time of your application. Create key transactions for those specific transactions that execute longer than your overall SLA. For example, for a typical web application, the Browser Apdex value could be 3 seconds. The APM Apdex value for a Java application could be 0.5 seconds. If your application is a collection of microservices that process transactions via APIs, the Apdex could be 0.2 seconds for each service. The idea is to set an appropriate Adex for every service that executes transactions.
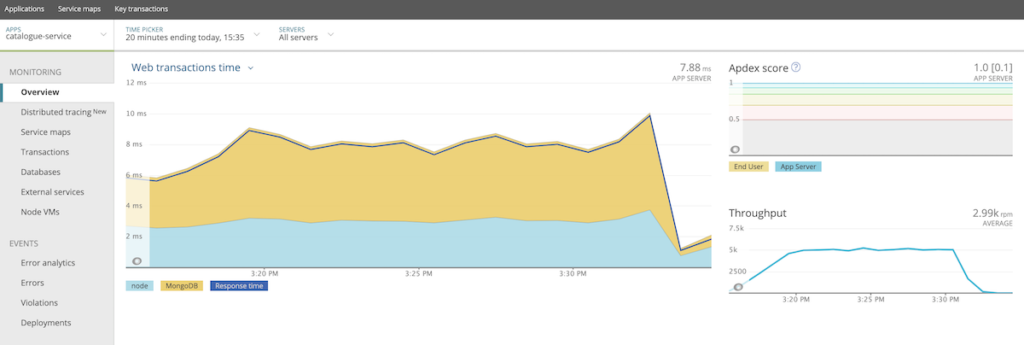
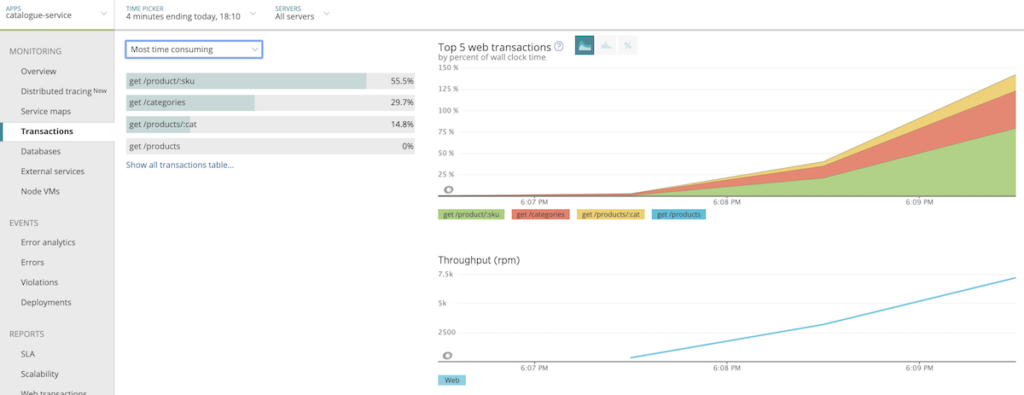
3. Design and execute a load test that methodically increases the number of users. Throughput and user load goals are unique to each application. For example, you could start the load test with 5 concurrent users and add 5 more users every 15 seconds. As you increase the user count, your load test will slowly approach the point of performance degradation, which will give you an understanding of how much load your application can handle.
Pro tip: Be methodical in designing your load tests—don’t throw the target workload onto an application or you’ll be left with chaotic results that are difficult to interpret. So, for example, if your goal is to reach 5,000 concurrent users, design a load test to reach half that target. If the application scales successfully to the halved target load, then go ahead and design the next test to double the load.
Additionally, if you’re load testing throughput rather than users or active sessions, you can still use the same approach to softly reach the target number of transactions per second. For example, if the throughput goal of your API is 200 transactions per second, start with a load test that will scale to reach 100 transactions per second.
4. In the APM Overview page for your application, change the view to see Web transactions percentiles and concentrate on the 95% line, as 95% is more sensitive and granular than the median or average.
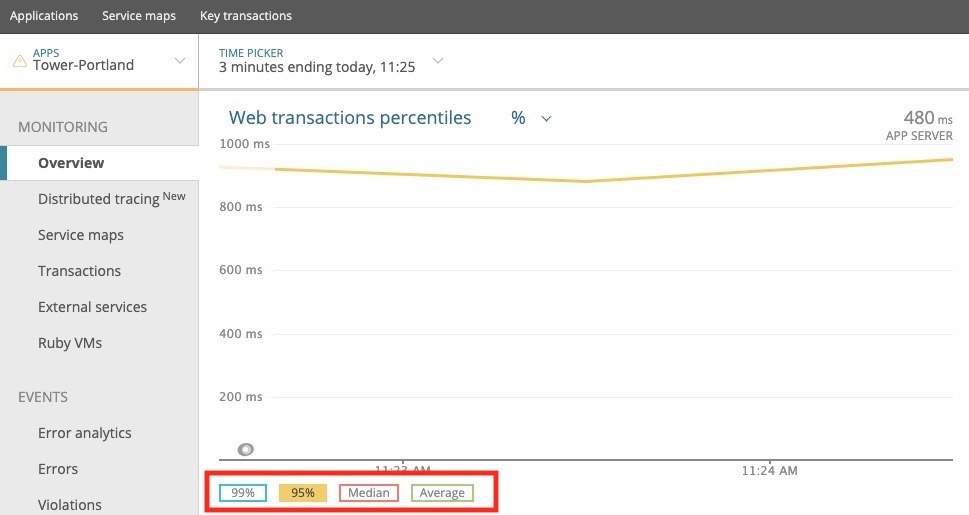
Highlight and zoom into the timeframe at a point just before the load test began to degrade. From this time span, you can perform deeper analysis (for example, dive into transaction traces, distributed traces, and errors), or switch from APM to Browser (for frontend to backend analysis) and New Relic automatically keeps this isolated timeframe in focus.
Pro tip: The key part of this test is identifying the first bottleneck. You don’t need to worry about what’s happening in the chart after the first buckle point—anything beyond that point is just a symptom that you should differentiate from root causes.
Part 2: Isolate the first bottleneck
As you troubleshoot the performance degradation, perform steps 5-9 below in whatever order makes the most sense in your situation. For example, you could start by analyzing response times with New Relic Browser and work backwards until you’re identifying code deficiencies in APM (a top-down approach). Or you could start with New Relic Infrastructure to identify resource limitations that lead to poor response times in Browser (a bottom-up approach).
5. Using the information gathered in step 4, use service maps to determine which application transactions from which internal or external services are degrading and causing the overall increased response times.
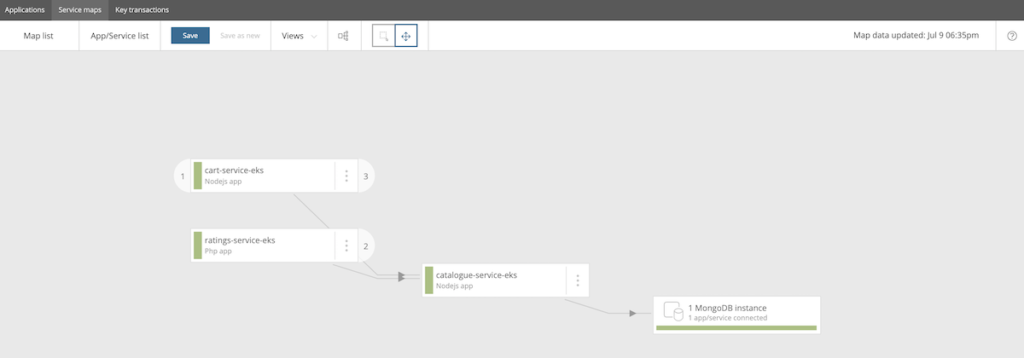
Pro tip: If you see any trends in the way multiple transactions are degrading, that usually indicates some resource is approaching its saturation point.
6. Use New Relic APM to progressively isolate code deficiencies or error conditions. Use transaction traces to isolate the exact code that is either degrading or throwing an error.
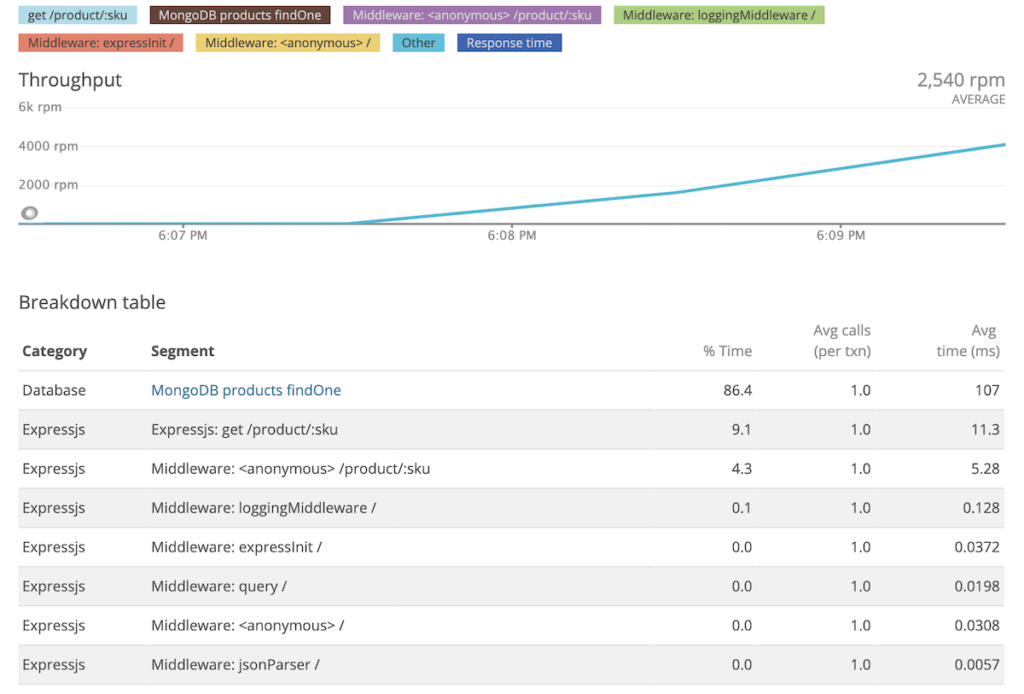
7. Use Infrastructure’s on-host integrations to identify any limitations in your infrastructure, such as web servers, JVMs, or databases.
8. Use Infrastructure to inspect each host/server in your application deployment to see if any hardware resources (CPU, memory, network, etc.) are being overused.
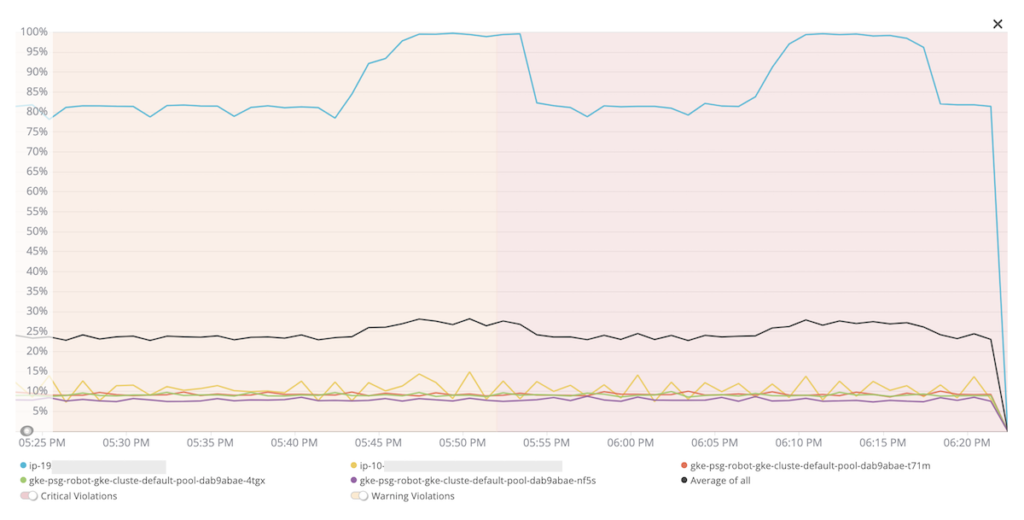
Pro tip: A hardware resource doesn’t necessarily have to be completely saturated in order for response times to degrade—even 70% saturation could lead to performance issues.
But if the bottleneck you identified in your load tests is not a hardware resource, check your servers’ software resources, including connection pools, datasource connections, and their TCP stacks. When software resources are saturated, they’ll often show up in Infrastructure as “queuing.”
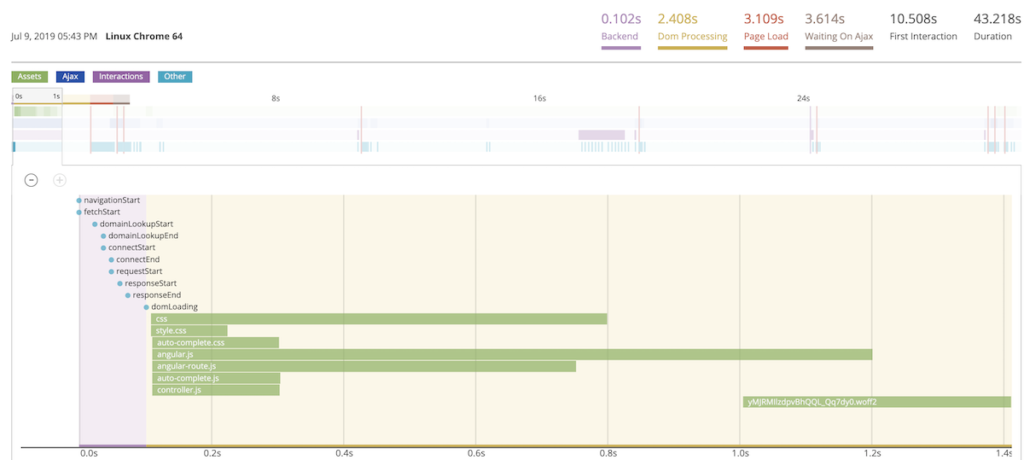
9. Use Browser to determine if any increased response times are originating from the frontend of your application. For example, when your site needs to render HTML assets, are Ajax requests to third-party remote servers causing slowdowns?
Part 3: Tune to alleviate the bottleneck
Once you identify the cause of the bottleneck, deploy new changes and resume load testing.
10. Make the necessary changes to your application deployment, and set a New Relic deployment marker to record the change. Tag this deployment marker with the details of your change (for example, “Added 2 CPUs to VM”).
Pro tip: Change only 1 variable at a time. If you change 2 or more things at once (for example, if you add more hardware resources and double the JVM heap size), you’ll muddle the picture of how each variable impacted the application’s overall load.
11. Rerun the load test from Part 1 and analyze the results. Determine if the results are the same, better, or worse—no difference means you didn’t identify the correct bottleneck. Keep or revert your change (repeating the previous steps, as necessary).
12. Continue the load testing process, eliminating bottlenecks as they occur, until you meet your load needs.
Keep going—performance engineering is an iterative process
Load testing and performance engineering are never “done.” Every component of your application deployment, from its workload to its features to its architecture, is constantly evolving. So once you’ve set up a realistic performance test, don’t change it just to change it. Something as simple as reconfiguring a test’s runtime settings could completely skew the results the next time you run it. The performance test should remain the constant while the application should hold the variables.
Additional load testing and performance analysis resources
Finally, here are a few other New Relic tools that could be handy for methodical load testing and performance analysis:
- Service maps: Identify connectivity and upstream/downstream dependencies between services in your application deployment.
- Distributed tracing: Get a clear picture of how transactions transverse services in your application.
- Dashboards: Track the KPI's you’re interested in watching during load tests with flexible, interactive visualizations.
Las opiniones expresadas en este blog son las del autor y no reflejan necesariamente las opiniones de New Relic. Todas las soluciones ofrecidas por el autor son específicas del entorno y no forman parte de las soluciones comerciales o el soporte ofrecido por New Relic. Únase a nosotros exclusivamente en Explorers Hub ( discus.newrelic.com ) para preguntas y asistencia relacionada con esta publicación de blog. Este blog puede contener enlaces a contenido de sitios de terceros. Al proporcionar dichos enlaces, New Relic no adopta, garantiza, aprueba ni respalda la información, las vistas o los productos disponibles en dichos sitios.

