It’s 2 a.m., and you wake to a torrent of alarms. A disk in a MySQL database has run out of space, and now your web service can’t process any requests. The situation snowballs, and the alarms keep pouring in.
Alert fatigue is real.
When you’re troubleshooting a cascading failure, every issue, upstream and downstream, triggers an alert. Even if all the alerts are related, you may not realize they are until you’ve sifted through all the noise and properly diagnosed the issue.
By eliminating the noise before it reaches you, AIOps helps you diagnose issues faster. New Relic Applied Intelligence (AI) correlates related alerts into one actionable issue using both machine learning and manually created decisions, so you can prioritize and focus on the issues that matter most. Now, instead of receiving five, 10, or 20 separate alerts, you’ll receive only one alert that contains visibility and context for all the related incidents.
New Relic AI uses machine-based (global) decisions to reduce alert noise. User-generated and suggested decisions allow you to tailor decisions to reduce further the total number of alerts you receive. By creating your own decision logic, you can apply knowledge of your system while gaining transparency and control over how and why New Relic AI correlates alerts.
In this post, we’ll explain suggested decisions and show you how to create and preview user-generated decisions to better understand and refine your correlation logic and further reduce needless alerts.
How to use suggested decisions
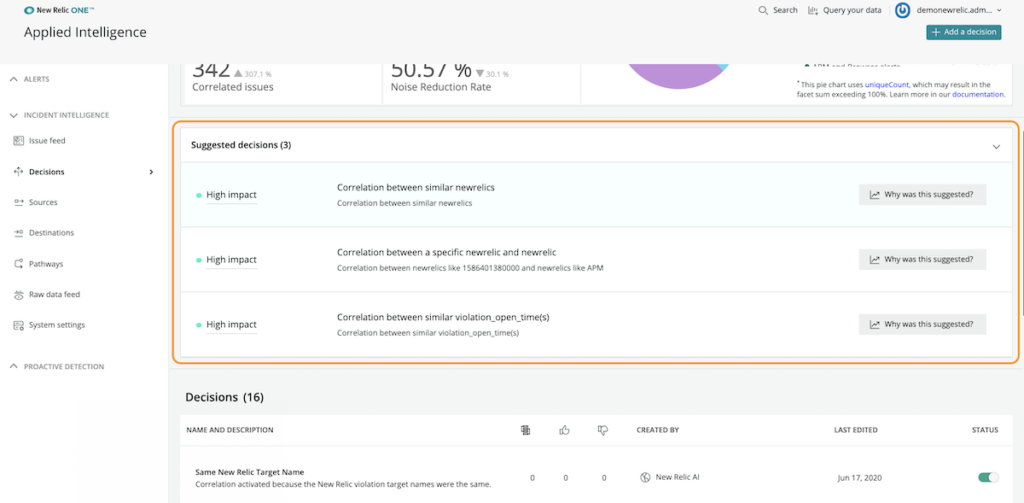
Decisions tailored to your data will more accurately correlate issues, so you receive fewer alerts. Once enough data is ingested, New Relic AI can detect patterns and predict relevant correlations based on the last 30 days of your data. These tailored decisions are shown in the Suggested decisions section of the Decisions page in New Relic AI Incident Intelligence.

For each suggested decision, you can:
- Review the logic New Relic AI used to create it
- Review the event settings that led to the suggestion
- View examples of incidents from the past seven days that would have been correlated, as well as the associated correlation rate
Once you’ve reviewed the suggested decision, you can either dismiss or enable it. Enabling a suggested decision will add it to the list of existing decisions, and it will immediately begin correlating incidents and reducing alert noise.
If you dismiss a suggested decision, you can choose never to see the decision again, or you can add it to the list of existing decisions with a disabled status and decide whether to enable it later.
As New Relic AI ingests more data, it will suggest more decisions leading to improved correlation rates and less noise from alerts.
How to build and preview user-defined decisions
New Relic AI will learn about your system over time, but as you get started, you'll want to help us understand what you may already know about your system. With that in mind, New Relic AI gives you the ability to build your own decisions. While you may know which alerts need to be correlated, you may not know how those correlations will affect the alerts you’ve configured. For any decision you create, New Relic AI draws on the last seven days of your data to preview the impact your decision will have on your alerts.
For this example, let’s imagine you’re receiving duplicate alerts for the same application from both Sensu and New Relic, and you want them correlated. Here’s how you’d do that in New Relic AI:
- Tell us what data to compare. Use the dropdown to define which two segments of your data you want to compare, or leave the field blank to evaluate all data. For our example, we want to compare data coming from the Sensu REST API to New Relic violations.

- Tell us what to correlate. Choose which attributes to correlate and which operator you want to use to compare them. For instance, if there are slight variations in the alerts, you could use is similar to. In our example, we want an exact match between Sensu and New Relic hostnames, so we’ll choose equals as the operator and host/name for both the first and second segment traits. (If we wanted to be more specific, we could add additional conditions, such as filtering by specific keywords in the alert message.)

- Give the decision a name and description. The decision’s name will show up in multiple places, so choose a name that others will recognize—short and clear work best. For our example, we’ve chosen a name that is both descriptive and concise: Host is the same.

- To preview the impact of your logic, click Simulate. In the preview, notice the following:
- The upper box of the preview shows you the potential correlation rate for the data you’re comparing, the total incidents, and the estimated total number of incidents correlated.
- The lower box of the preview shows examples of issues from the previous seven days of your data that would have been correlated had this decision been in place.
- From here, you can decide if you want to create the decision, or you can go back and fine-tune the correlation and adjust the logic to see how it would affect the potential correlation rate.

- Once you’re confident with your decision logic, click Create decision. It will be added to your list of decisions and will begin correlating alerts.
When you’re creating decisions, remember these three tips:
- A higher correlation rate isn’t necessarily better. You could correlate all New Relic violations in a 20-minute period and the correlation rate would be 100%, but that wouldn’t be very useful.
- Start small. Start with a targeted decision. Creating several targeted decisions is better than creating one broad decision.
- Check your work. How many alerts do you have? How many are correlated? Take a look at the examples—do they make sense?
With real-time feedback, you can be confident in the impact of your decision. You can fine-tune your logic to obtain the most accurate incident correlation and the most actionable alert noise reduction. You know your data best—apply that knowledge to quiet your alerts and achieve faster mean time to resolution (MTTR).
To learn more about building decisions, see the New Relic AI documentation.
How to know if your decisions work
To help you better understand why incidents are correlated and how that affects the total number of alerts you receive, New Relic AI surfaces key statistics on the Decisions page. Along with visibility into reasons why incidents are correlated, you can easily find the correlation rate, total correlations, noise reduction, and flapping effectiveness.

Example: measuring flapping effectiveness
Flapping detection and suppression is an additional way to reduce alert noise. When an issue is “flapping,” it’s cycling between an open and resolved state, creating a new alert every time it cycles. Effectively handling these can reduce the total number of alerts sent to you and your team.
New Relic AI automatically identifies flapping issues by noting any issue that opens and resolves multiple times within a short time window. When a flapping issue is identified, it’s marked isFlapping once, and the grace period for that type of issue is extended. If it closes within that grace period, you won’t be alerted, but if it remains open after the grace period has expired, you’ll receive an alert.
In the statistics widget, the effective handling of flapping is calculated with the following New Relic Query Language (NRQL) query:
SELECT percentage(count(*), where 1=1) * (1-(FILTER(count(*),WHERE EventType()= 'IssueClosed' AND isFlapping = 'true') /FILTER(sum(numeric(eventCount)), WHERE EventType()= 'IssueClosed' AND isFlapping = 'true'))) as 'Flapping effectiveness' FROM IssueClosed since 1 week ago
This query collects the total number of closed issues that contained a flapping alert and divides it by the total issues that were flapping. For instance, having a flapping effectiveness of 97.2% equates to only 28 surfaced issues per 1,000 flapping incidents, saving you from being alerted to the other 972 flapping alerts.
If you want additional visibility into tracking flapping alerts, you can dig deeper using the isFlapping attribute in NRDB to build dashboards, charts, and more.
Say you’re interested in knowing how many flapping issues were closed in the last week. You could find that information with the following query:
SELECT count(*) FROM IssueClosed WHERE isFlapping = 'true' TIMESERIES 1 day since 1 week ago
It’s difficult to know whether you’ve chosen the right threshold for an alert. You can use the isFlapping attribute to track flapping over time so that you accurately judge when it would be prudent to adjust thresholds for more effective alerting and additional noise reduction.
Reducing alert fatigue starts with the right decisions
When the pager goes off at 2 a.m., it’s essential that you’re working from the right set of alerts. Whether you use machine learning-based decisions or translate your knowledge into decision logic, understanding why and how New Relic AI correlates incidents will help you build trust in your incident response process. More importantly, you’ll reduce the total number of alerts you receive when it’s time to dig to the root of a problem.
Check out Accelerate Incident Response with AIOps to learn more about how New Relic Applied Intelligence can help you reduce noise and lower MTTR.
Las opiniones expresadas en este blog son las del autor y no reflejan necesariamente las opiniones de New Relic. Todas las soluciones ofrecidas por el autor son específicas del entorno y no forman parte de las soluciones comerciales o el soporte ofrecido por New Relic. Únase a nosotros exclusivamente en Explorers Hub ( discus.newrelic.com ) para preguntas y asistencia relacionada con esta publicación de blog. Este blog puede contener enlaces a contenido de sitios de terceros. Al proporcionar dichos enlaces, New Relic no adopta, garantiza, aprueba ni respalda la información, las vistas o los productos disponibles en dichos sitios.


