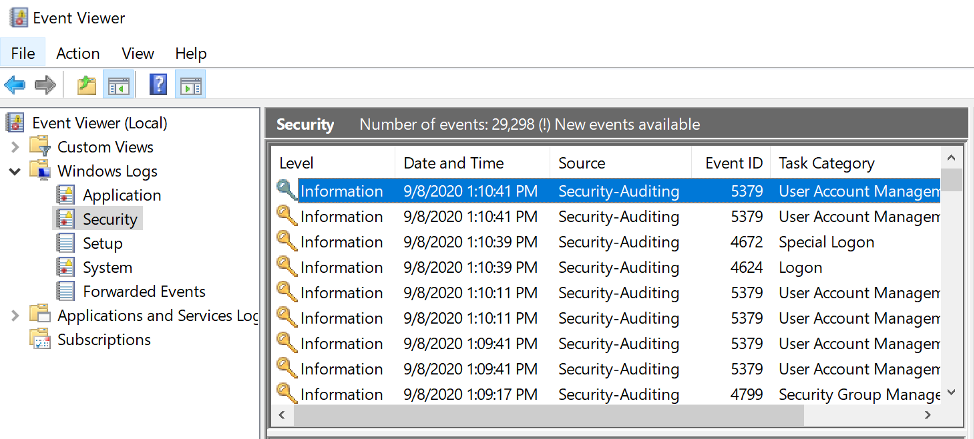
Earlier this year, we added log forwarding to our Infrastructure agent, giving you the ability to send infrastructure logs to New Relic One.
After overwhelming requests, we’ve extended that capability, so you can forward Windows Events for log management in New Relic One’s Telemetry Data Platform. Now, if you’re a Windows user, you can send all logs to New Relic One or use our updated filters to select exactly which log types and specific messages you’re interested in forwarding based on their EventID.
Windows Event logs–vital observability data
Windows Event logging provides a standard, centralized way for applications (and the operating system) to record important software and hardware events. The event logging service records events from various sources and stores them in a single collection called an event log.
Windows Event logs are a vital source of observability data for our Windows users, and implementing this functionality makes it easy to get that data into New Relic One. In this article, we’ll quickly show you how to take advantage of this helpful feature.
Get started with Windows Event logs in New Relic
To start sending Windows Event logs to New Relic One, you just have to add a simple YAML configuration file in our Infrastructure agent’s configuration. That looks like this:
logs:

 - name: windows-security

   winlog:

      channel: Security

      collect-eventids:

      - 4624

      - 4265

      - 4700-4800

     exclude-eventids:

      - 4735
As you see, you have to define what channel you want the Infrastructure agent to be listening to. For this particular channel, you can also define which EventIDs should be collected or which should be excluded. (Note that the excluding rule takes precedence over the including one). This can be done by listing individual EventIDs or by defining a range.
If no filter is defined, all logs from that channel will be forwarded to New Relic. To configure other channels, you’ll have to define another configuration block similar to our example above. Once you have defined the configuration file, you should start to see your Windows Events in New Relic Logs. With our innovative log management, experience more intuitive log analytics.
To start taking advantage of this feature now, sign into New Relic One or sign up for Telemetry Data Platform for free and ingest 100 GB free every month.
Las opiniones expresadas en este blog son las del autor y no reflejan necesariamente las opiniones de New Relic. Todas las soluciones ofrecidas por el autor son específicas del entorno y no forman parte de las soluciones comerciales o el soporte ofrecido por New Relic. Únase a nosotros exclusivamente en Explorers Hub ( discus.newrelic.com ) para preguntas y asistencia relacionada con esta publicación de blog. Este blog puede contener enlaces a contenido de sitios de terceros. Al proporcionar dichos enlaces, New Relic no adopta, garantiza, aprueba ni respalda la información, las vistas o los productos disponibles en dichos sitios.


